Help Center > Competitive Market Analysis > How to Customize Your Competitive Market Analysis Pricing Scattergram
How to Customize Your Competitive Market Analysis Pricing Scattergram
While most Scattergrams that populate automatically work quite well, there are times when you will want to customize them, either adding detail or fixing them when they don’t look quite right. How do you know if it looks right? We want the trend line going up and to the right and the dots for the properties semi-close to that line. If it seems off then these customizing controls can help.
They are divided into (3) main areas: X-Axis Variable Options, On Graph Controls and Data Sheet Controls.
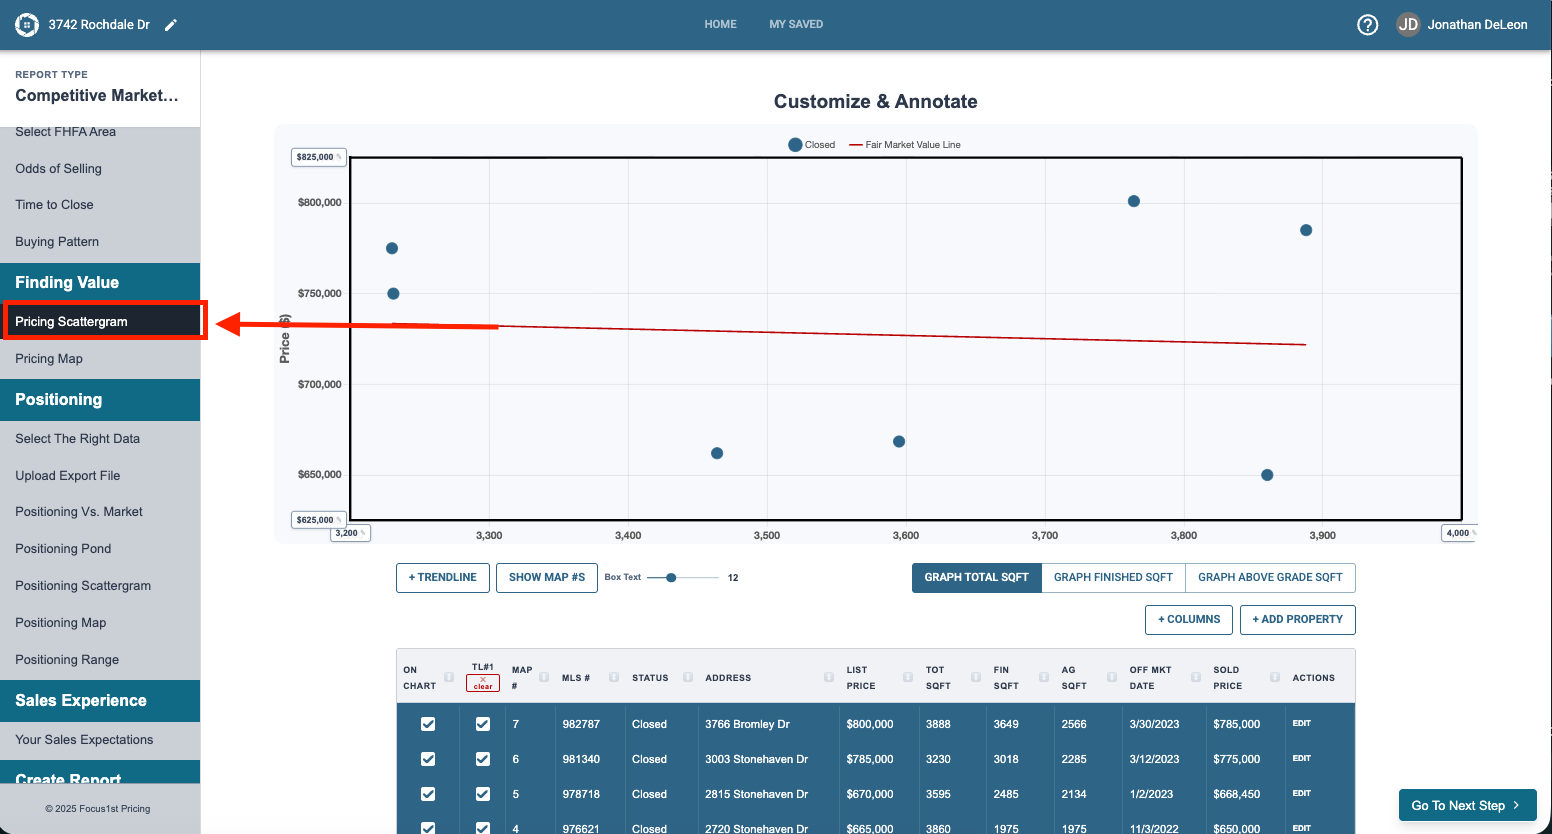
To use them first you’ll need to open the Pricing Scattergram Step on the sidebar.
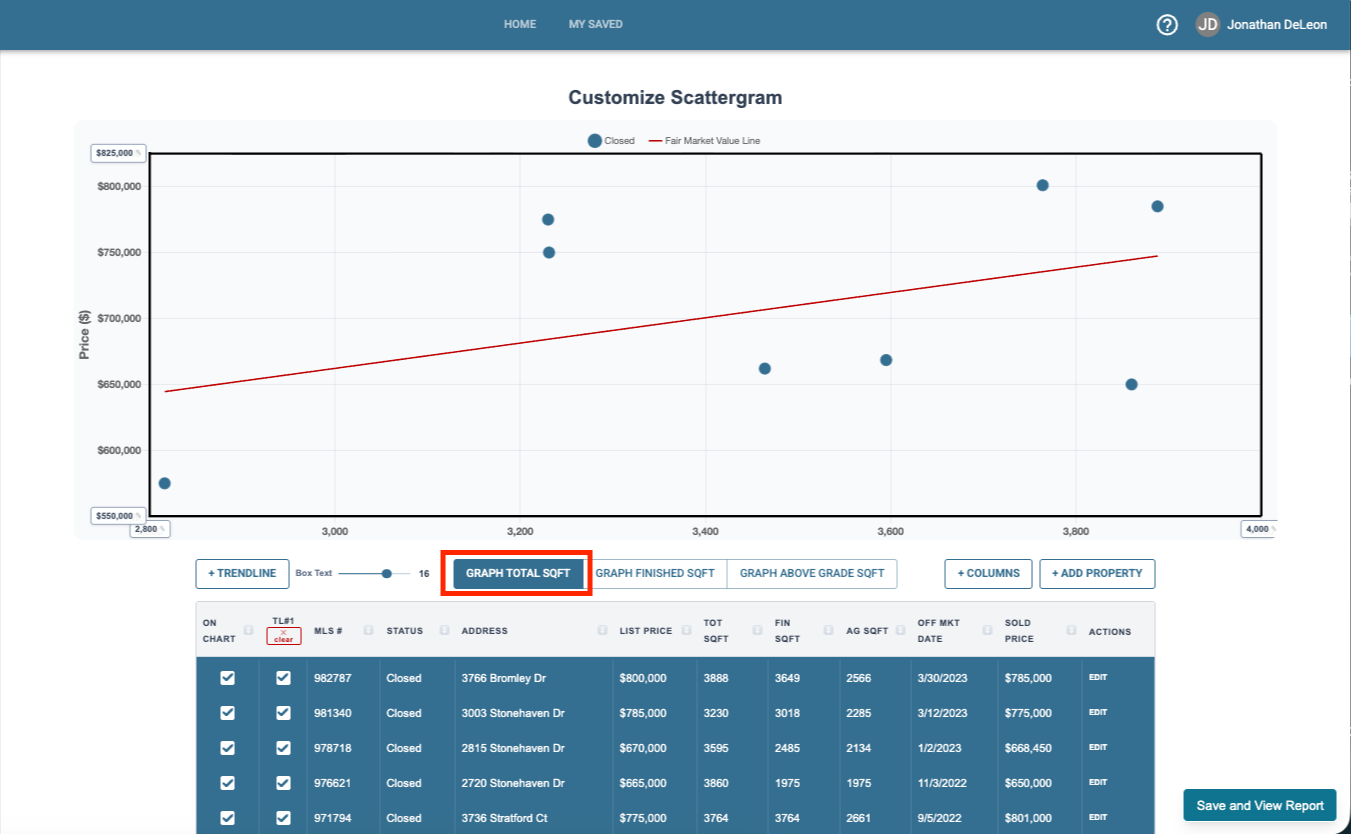
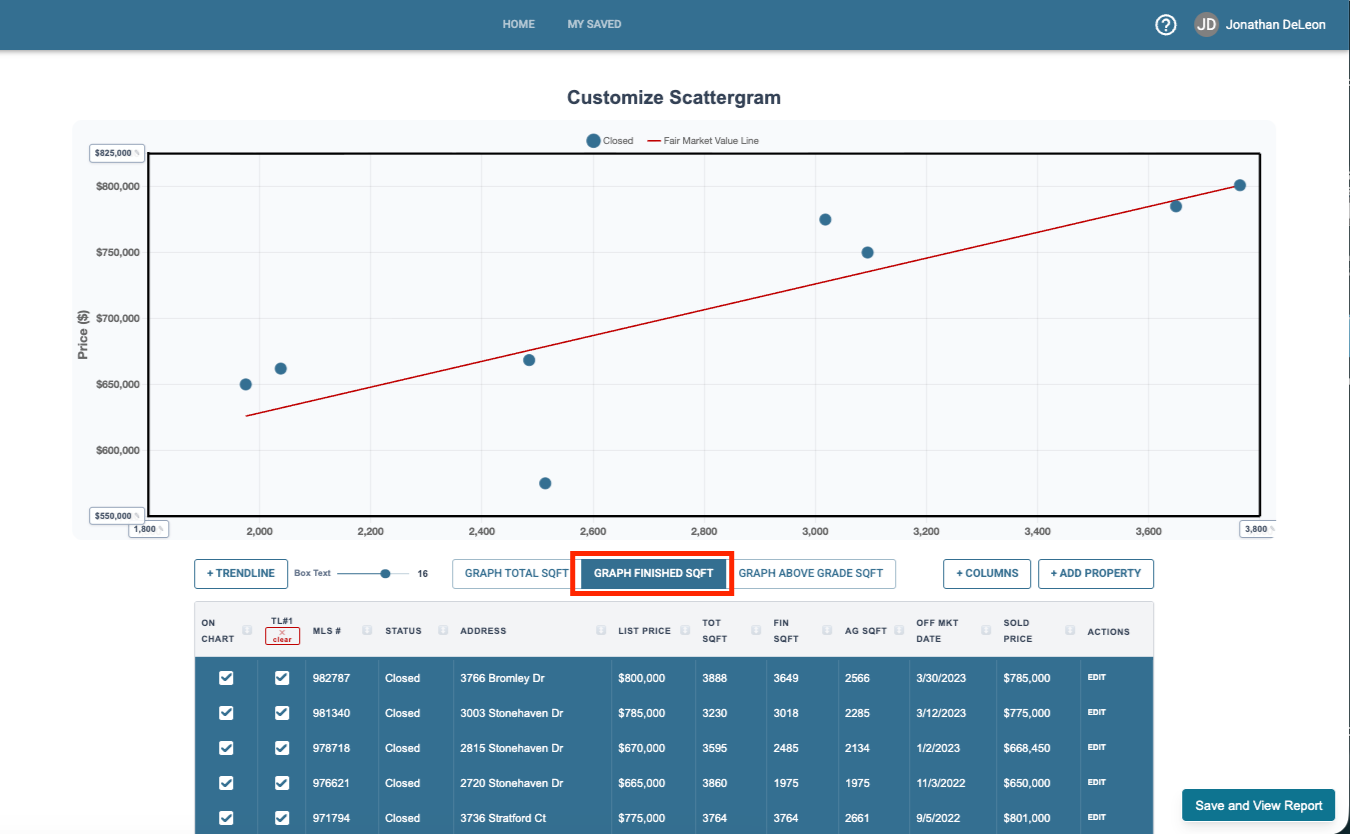
The first customization control you’ll want to use is the X-Axis variable options. Many times by switching the X-Axis we see better correlation of the data and have more accurate scattergrams. To use them simply click on the button and the bottom variable will change.
The on graph controls allow you to do a number of things to add detail as well as control the scope and size of the graph itself.
On the top left, bottom left and bottom right corners you’ll see boxes you can type in to manually scale the graph.
Scattergram Goal
Customize Scattergram
X-Axis Variable Options
On Graph Controls
Data Sheet Controls
Labelling Controls
Special Subject Property Option

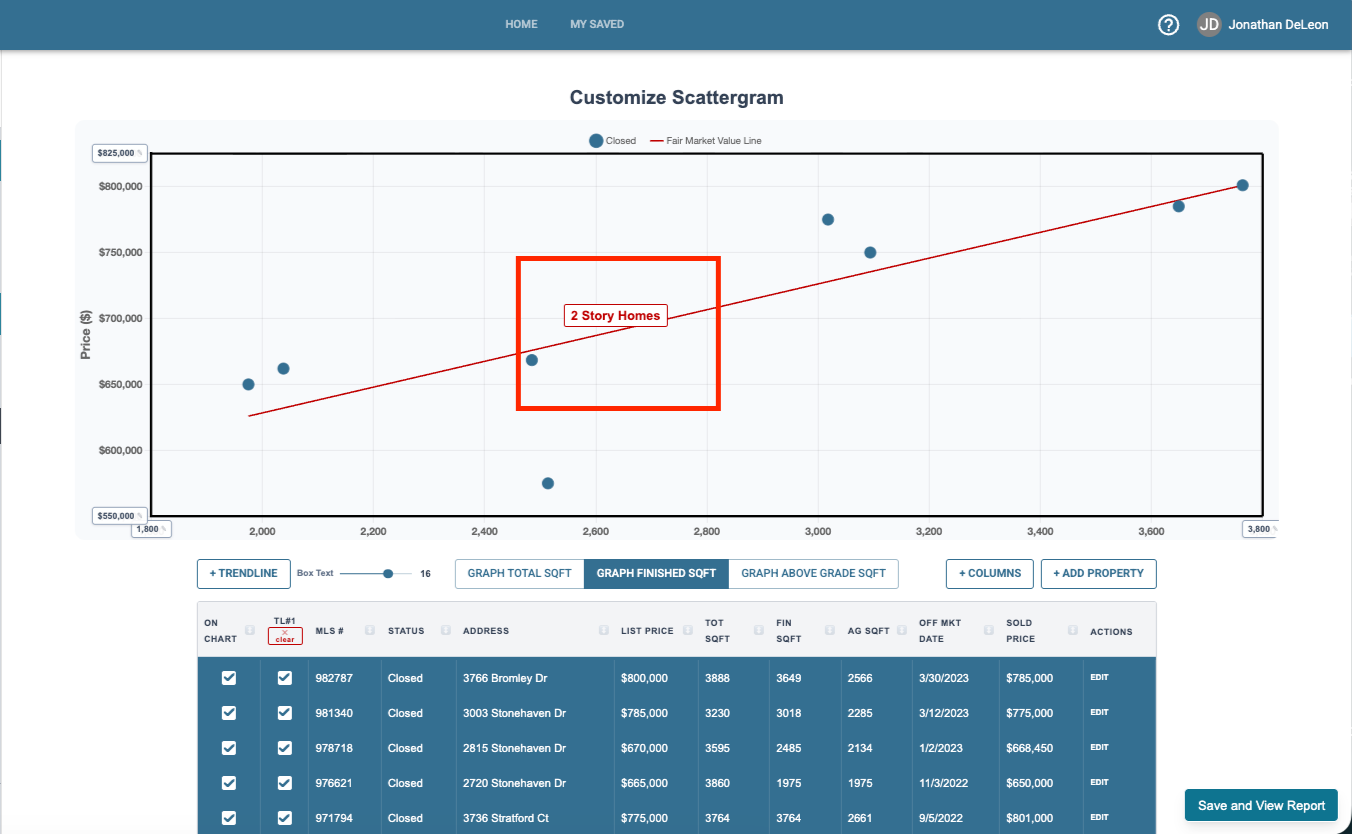
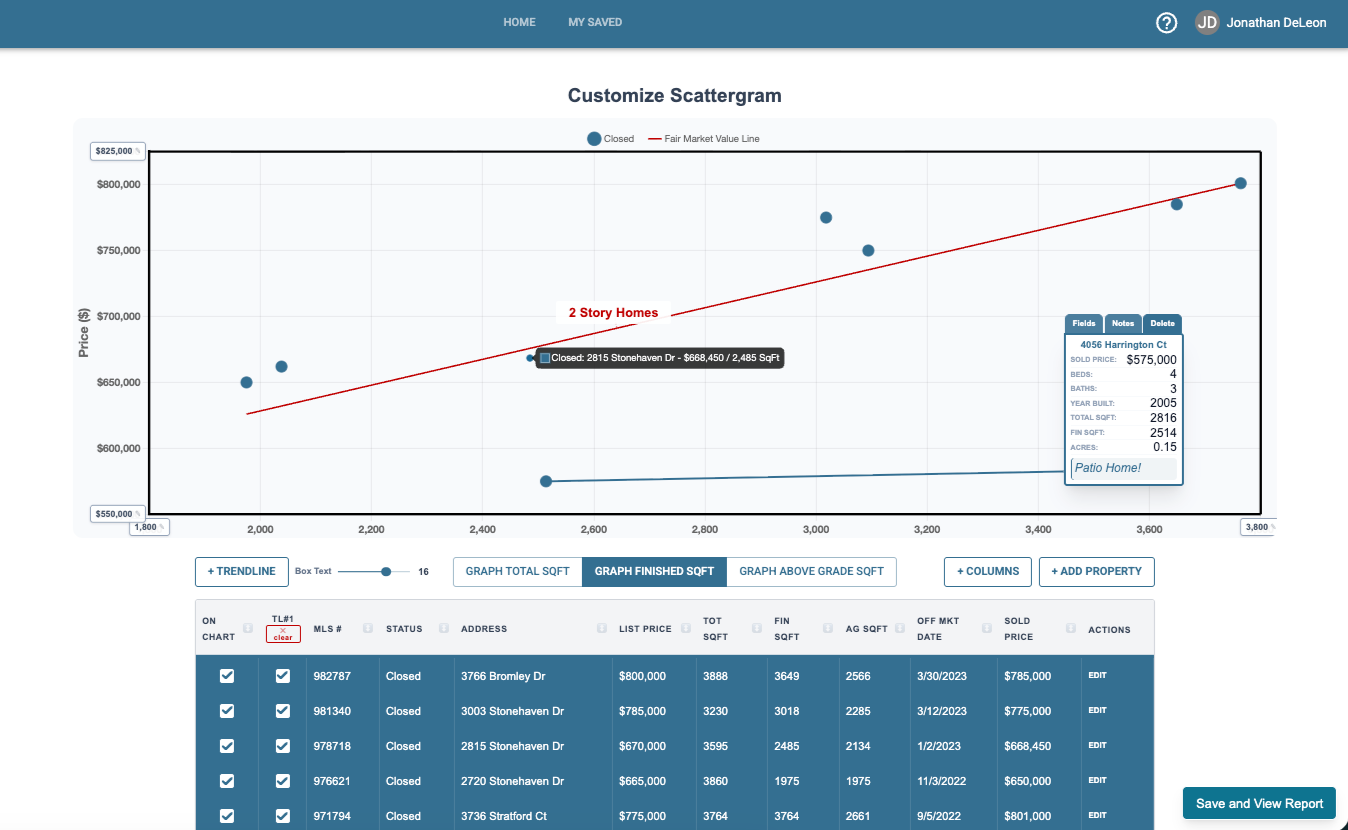
You can add a label to the trend line by clicking on it and typing in the box.
(Delete the label by erasing all the text in it)
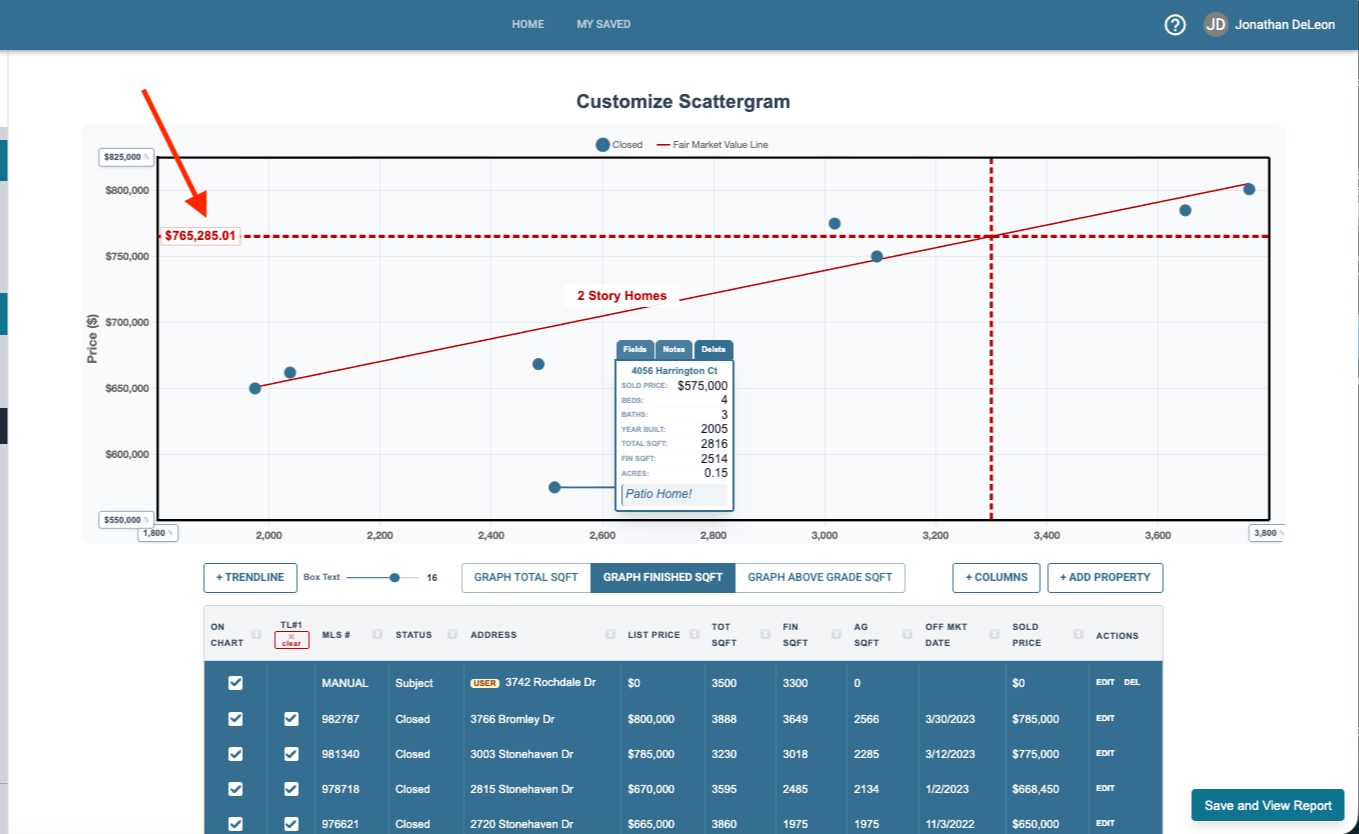
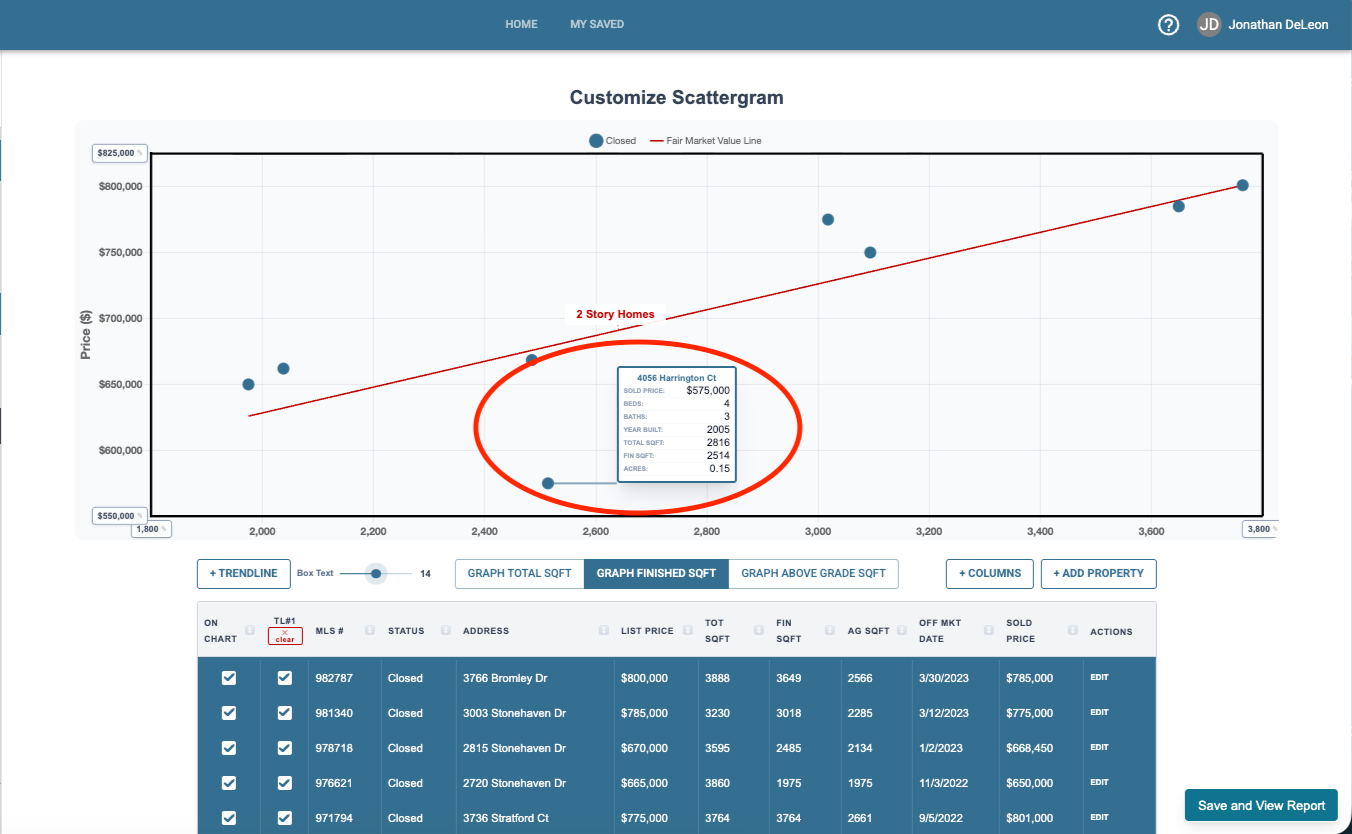
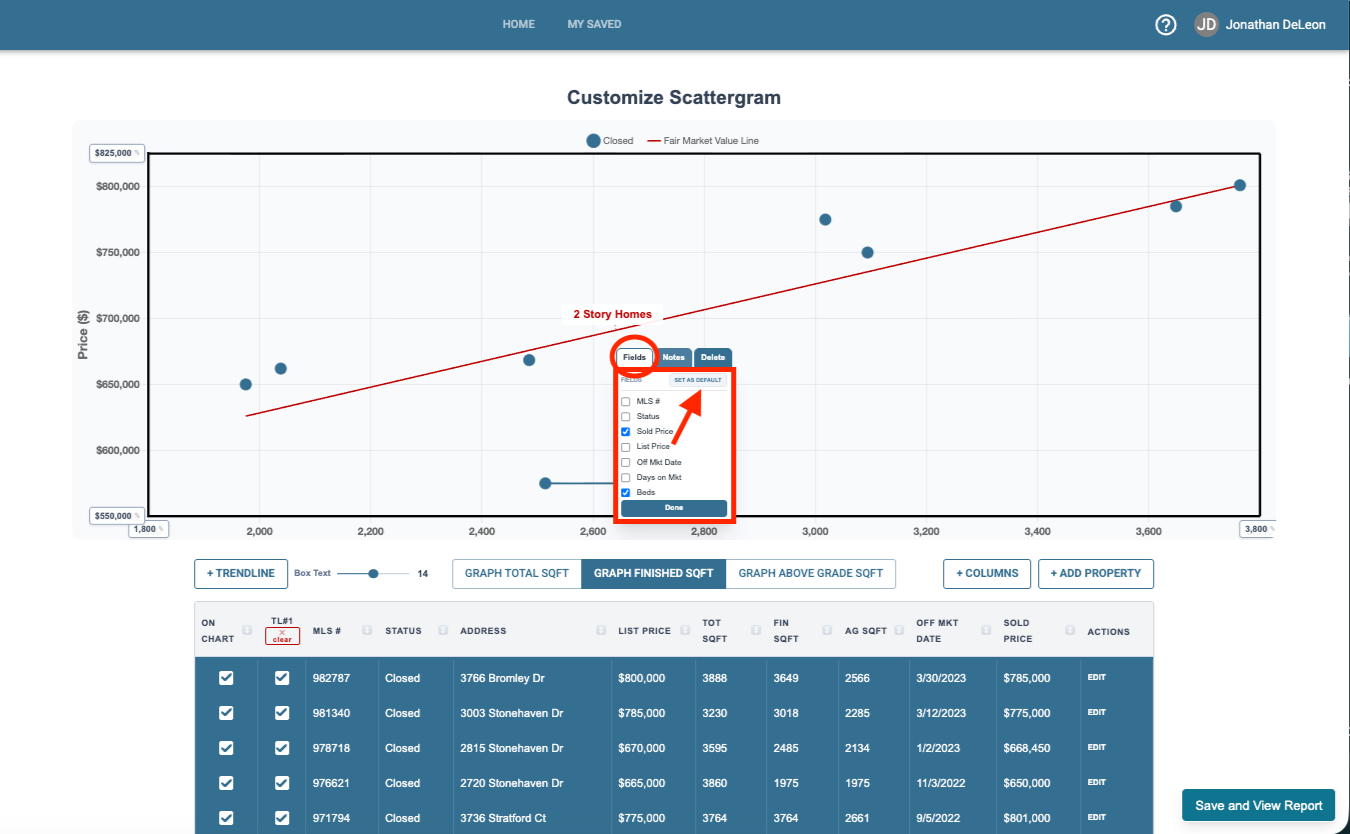
You can add textboxes to any property dot by clicking on it.
When selected each textbox has three tabs.
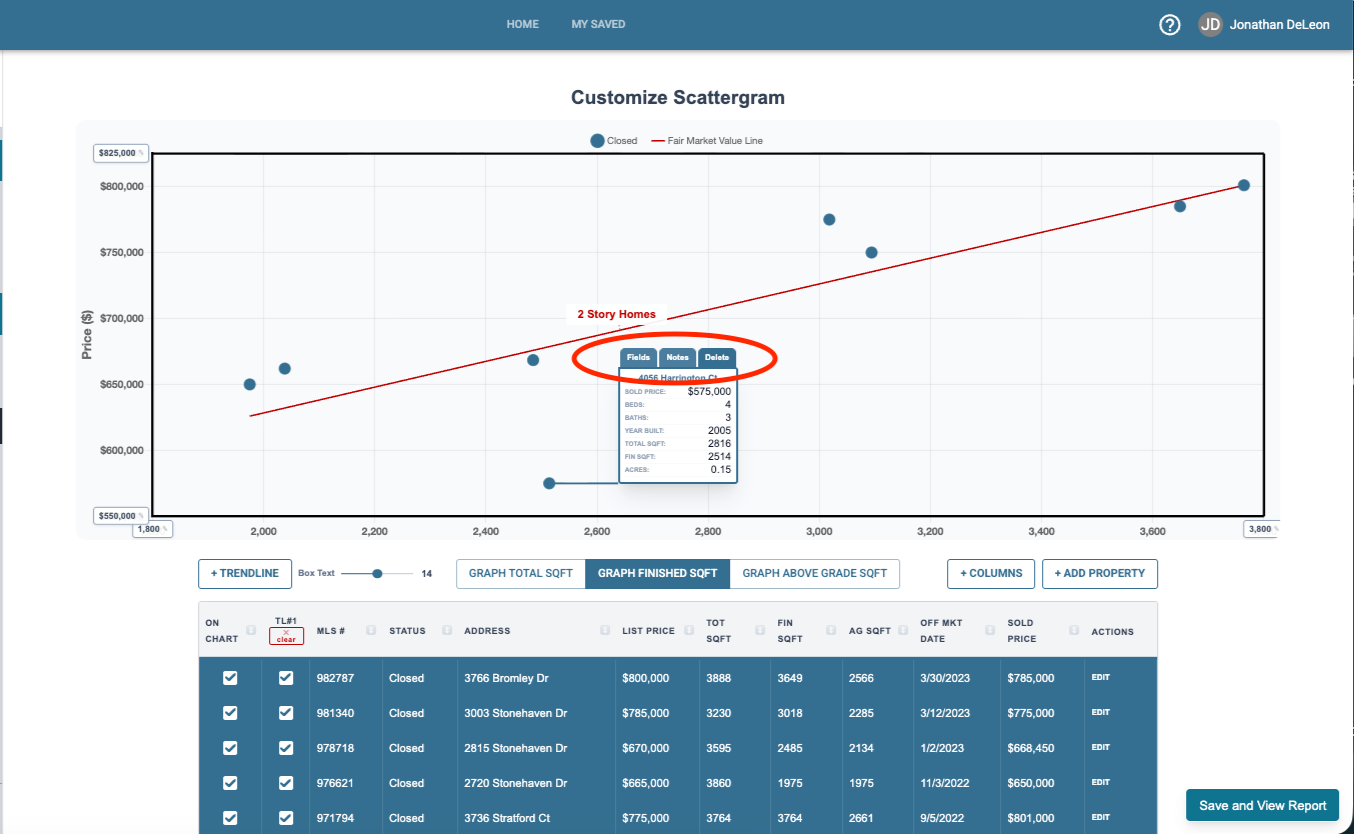
Fields lets you select which fields from the data are brought up into that box. You can also save you desired default fields here.
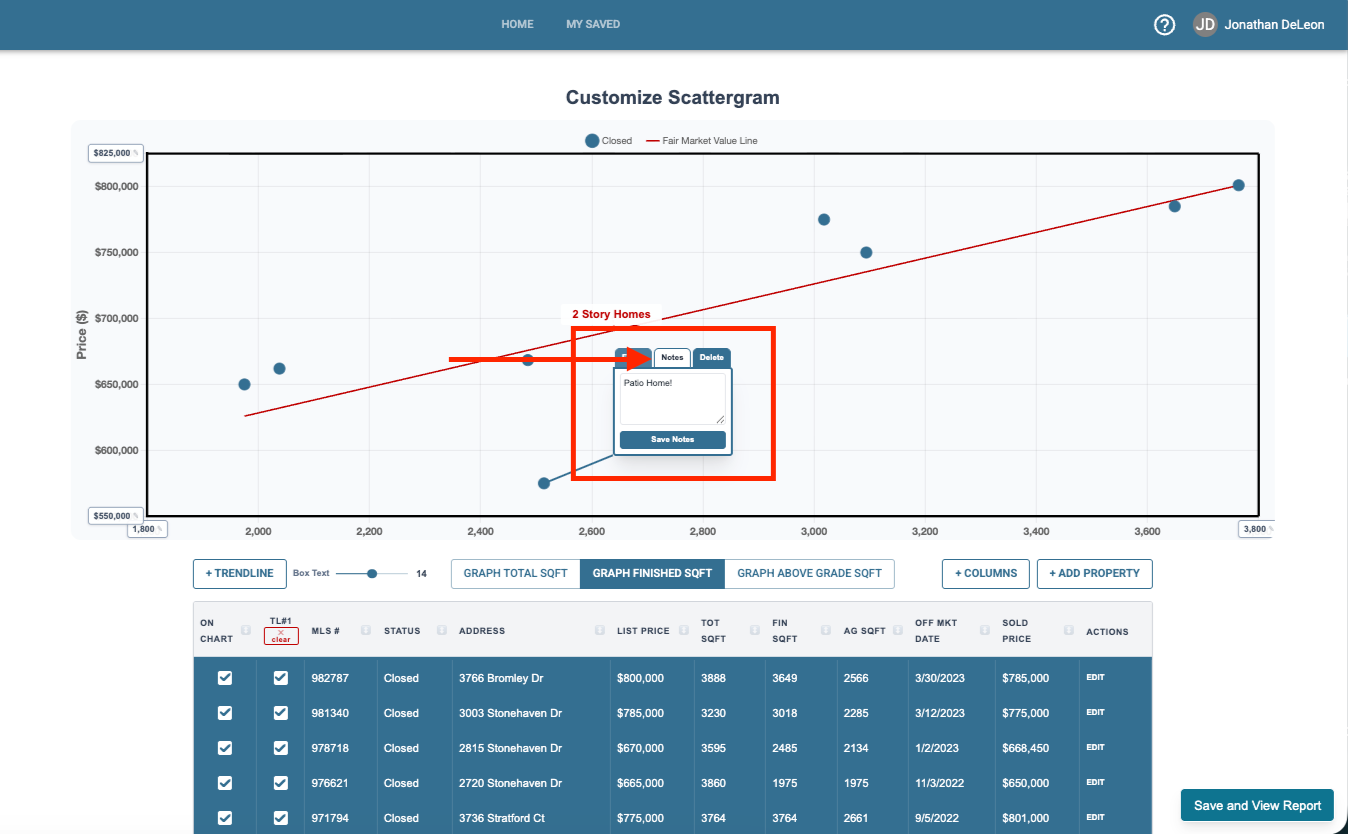
Notes lets you type in custom information that shows at the bottom of the text box.
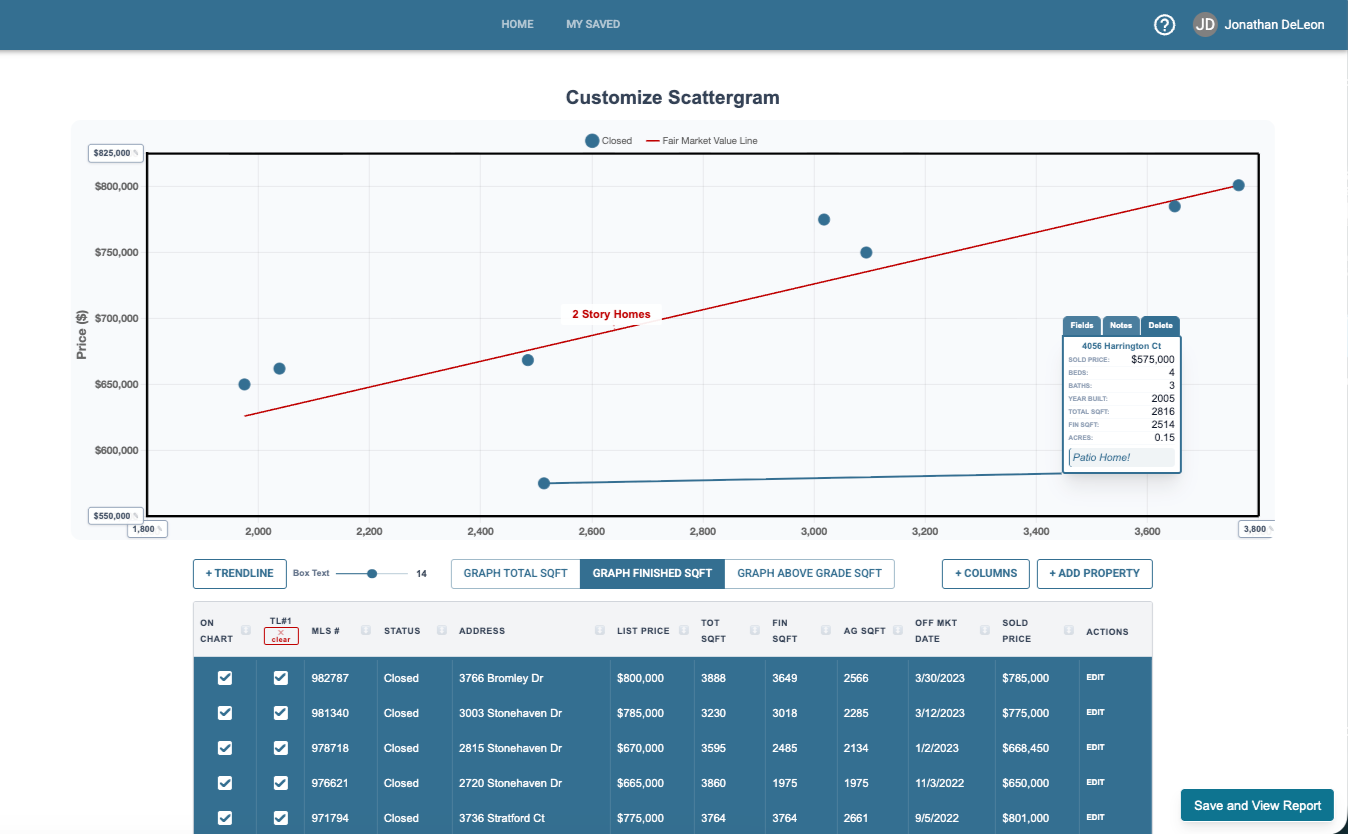
Delete removes the text box from the graph.
All text boxes can be moved by clicking and dragging them to your desired position. You’ll see the line move with the text box so it still stays connected with the property.
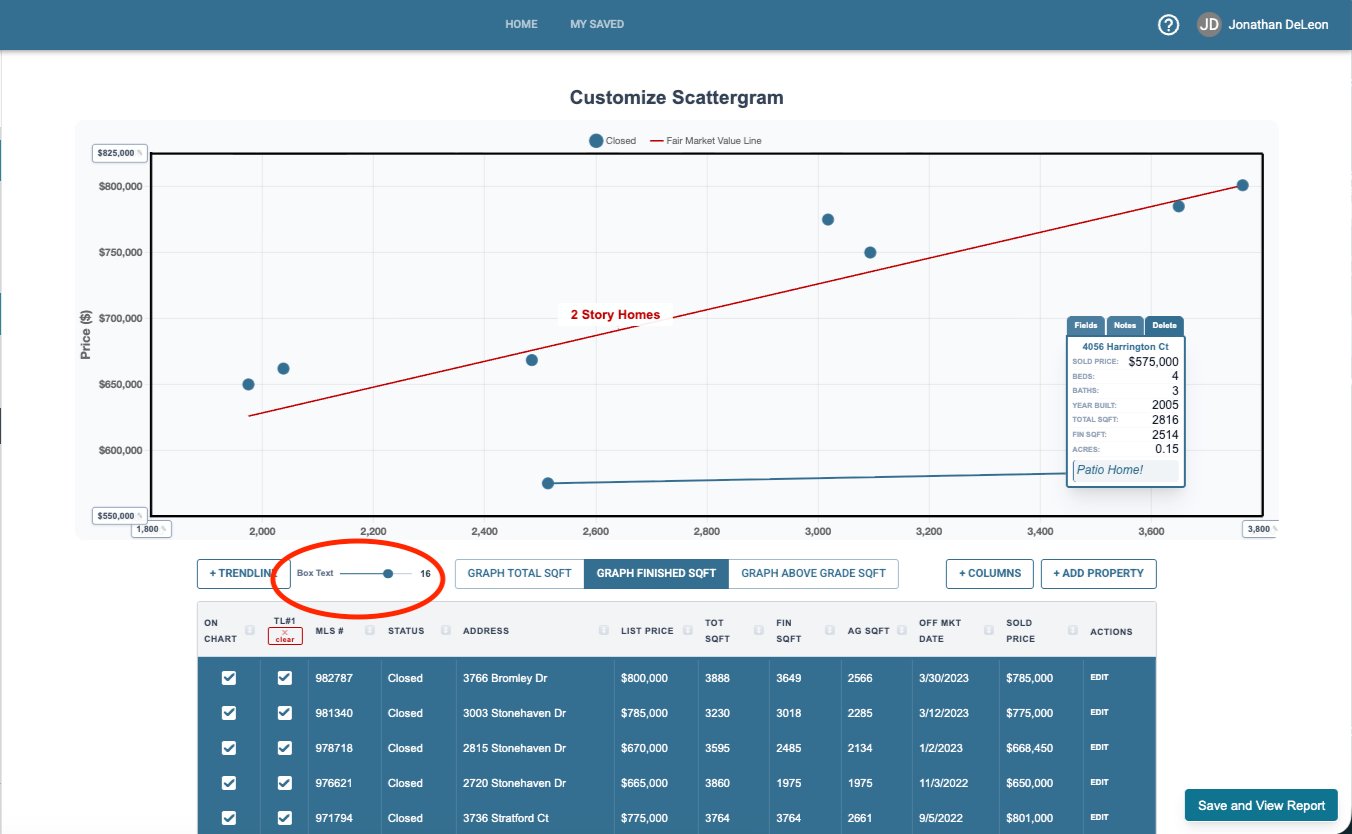
You can adjust the size of the text in the textboxes using the slider bar below the graph.
You can also simply hover over a dot to inspect the address and price.
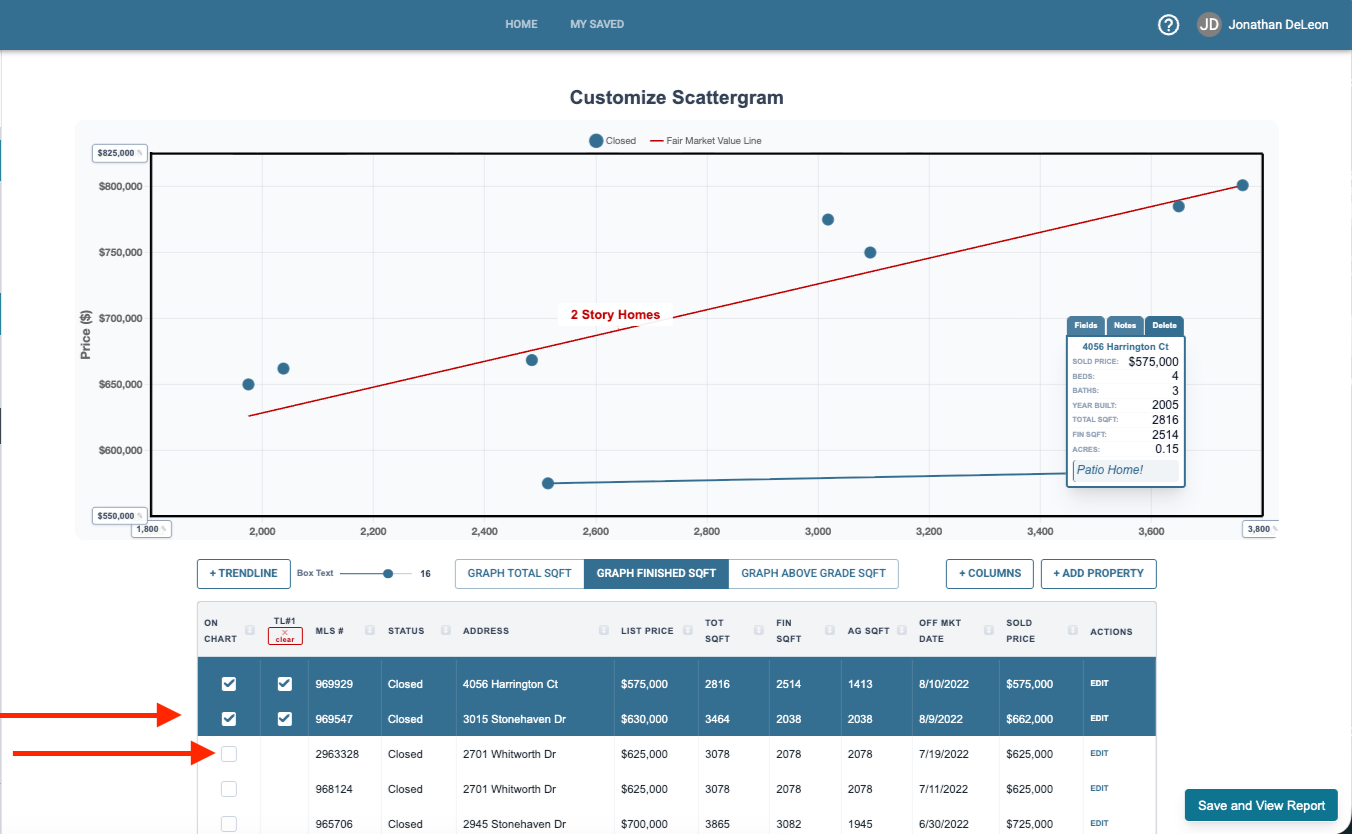
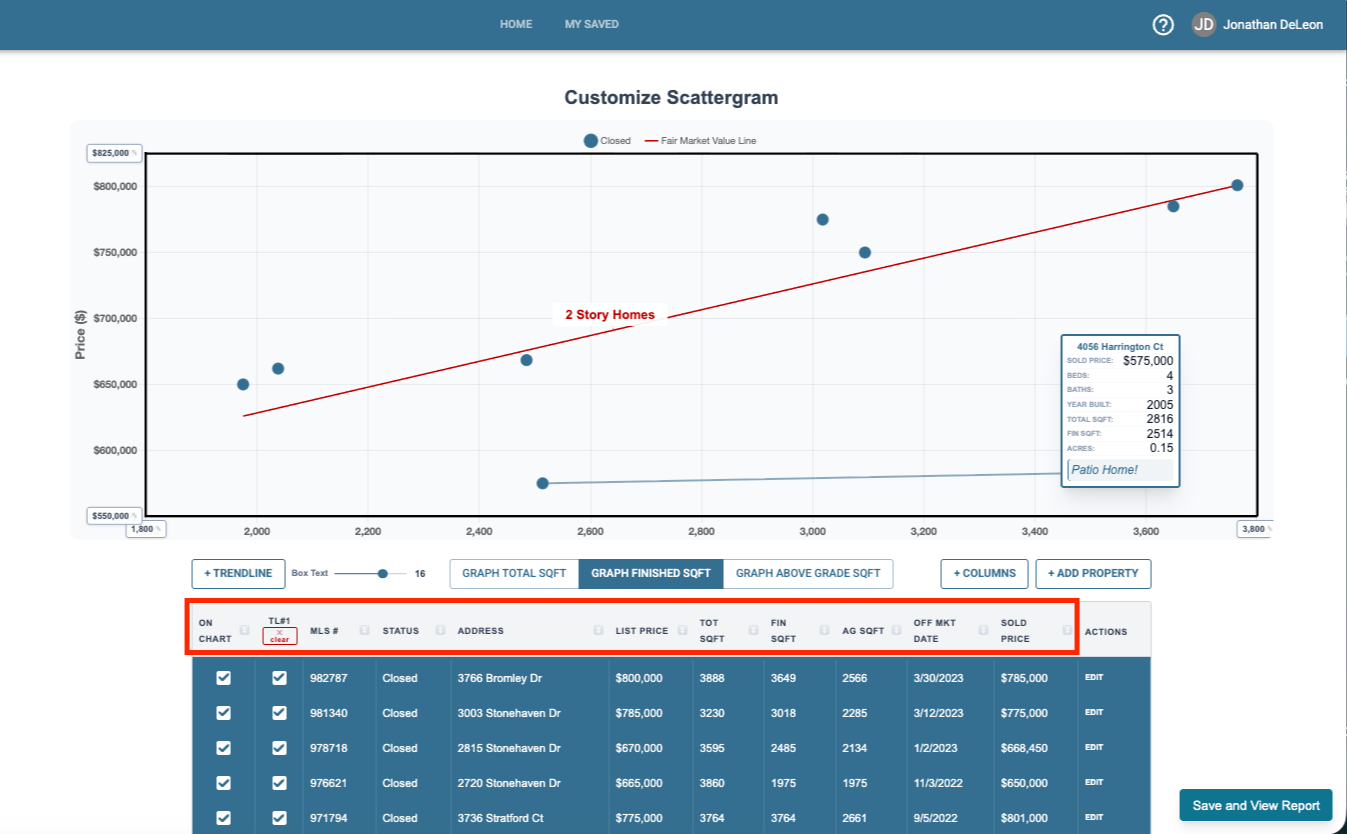
The data sheet controls let you control the properties represented on the graph.
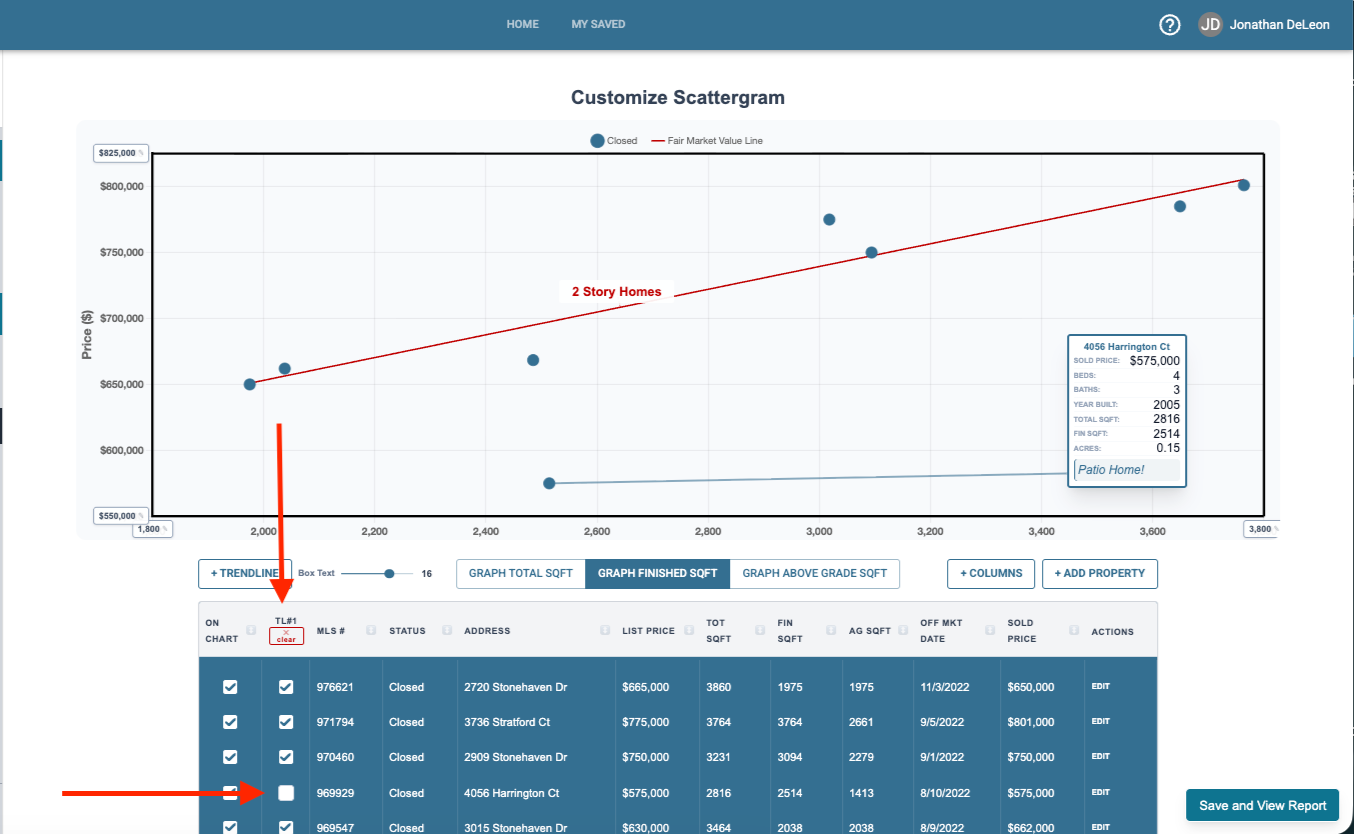
To include a property click on the property below to turn it blue. You’ll now see it on the graph. To remove it, click again and it will turn white and no longer be on the graph.
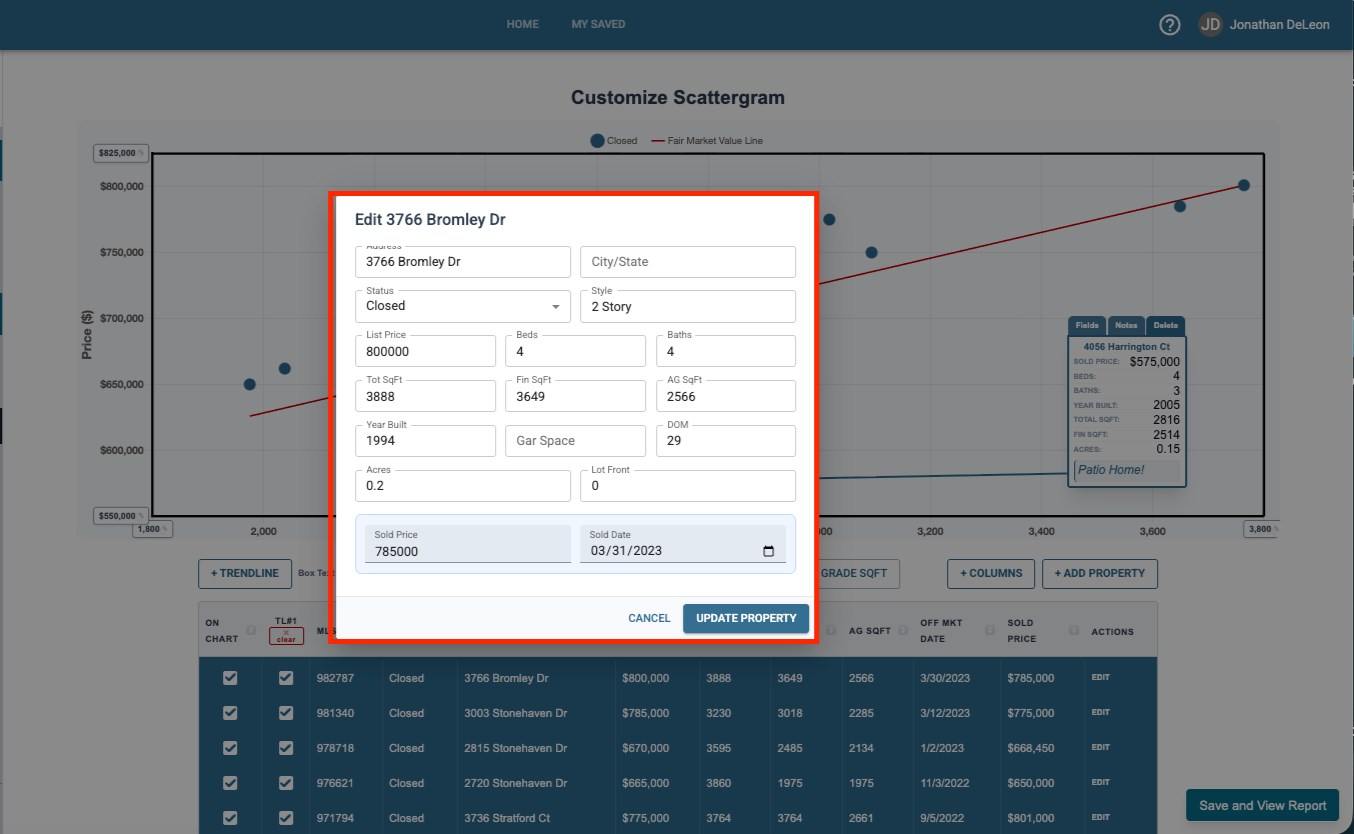
To edit any details on the data sheet, click the edit button to the side of the property.
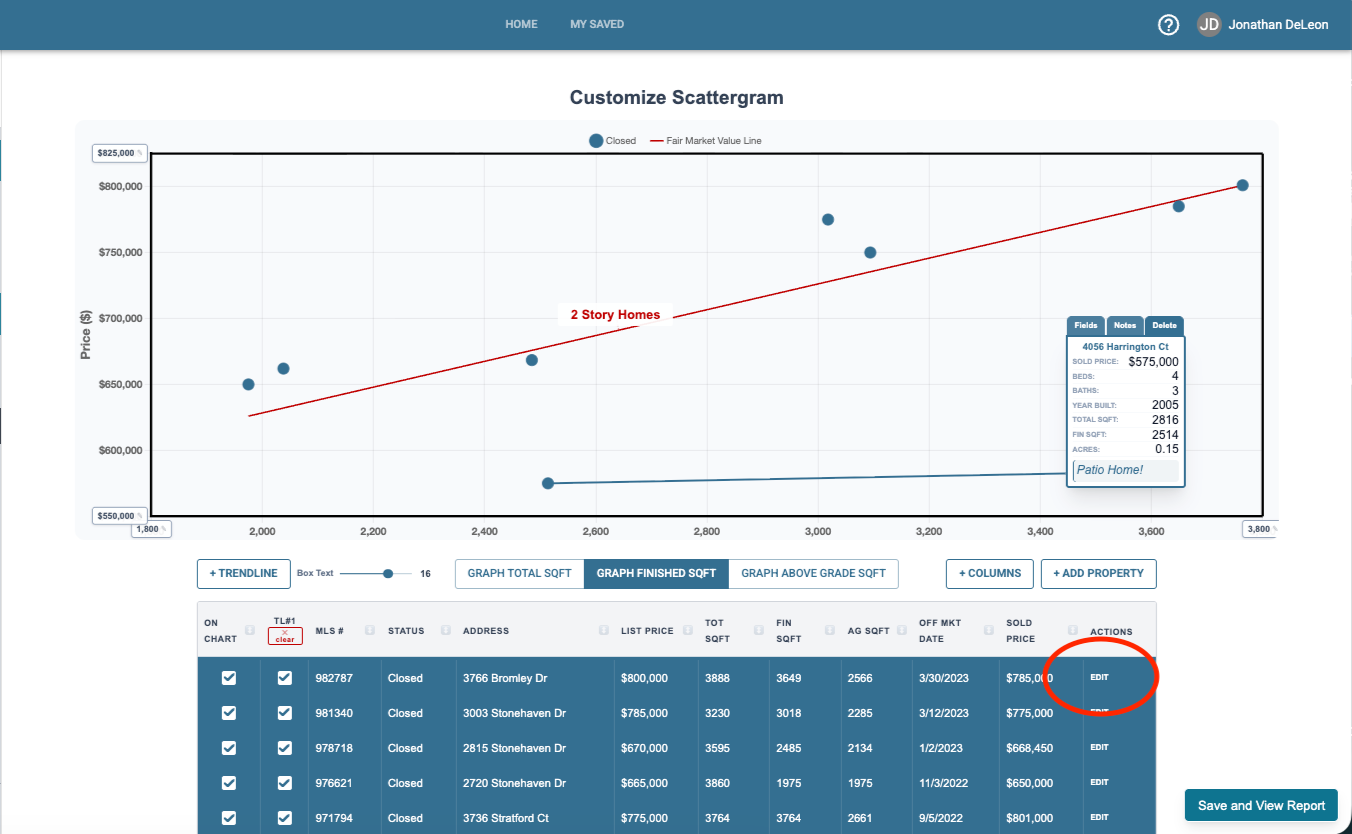
Type in any changes and click Update Property on the window that pops up.
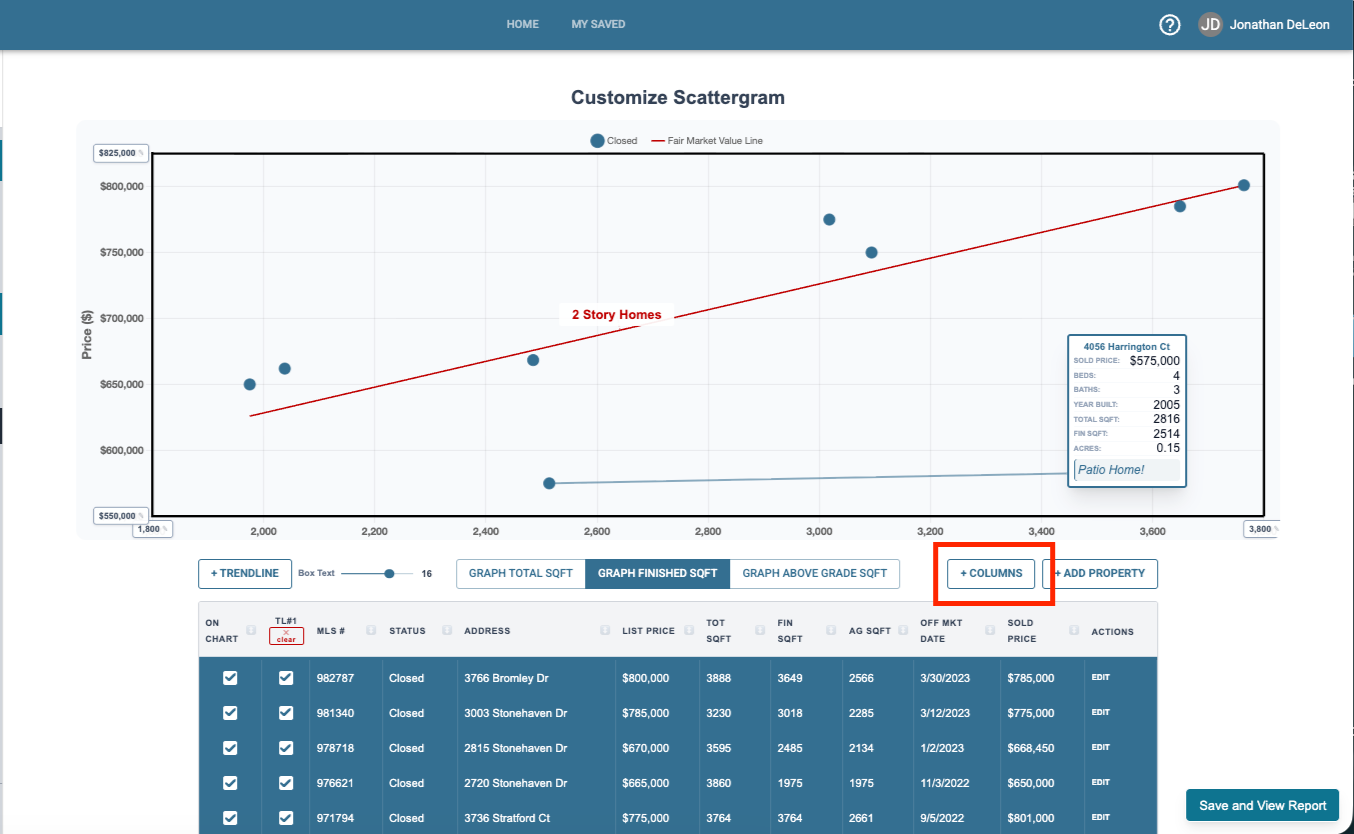
Not all the data that the program has shows in the columns below. You can control which data you see by clicking the +Columns dropdown and selecting your data sheet view.
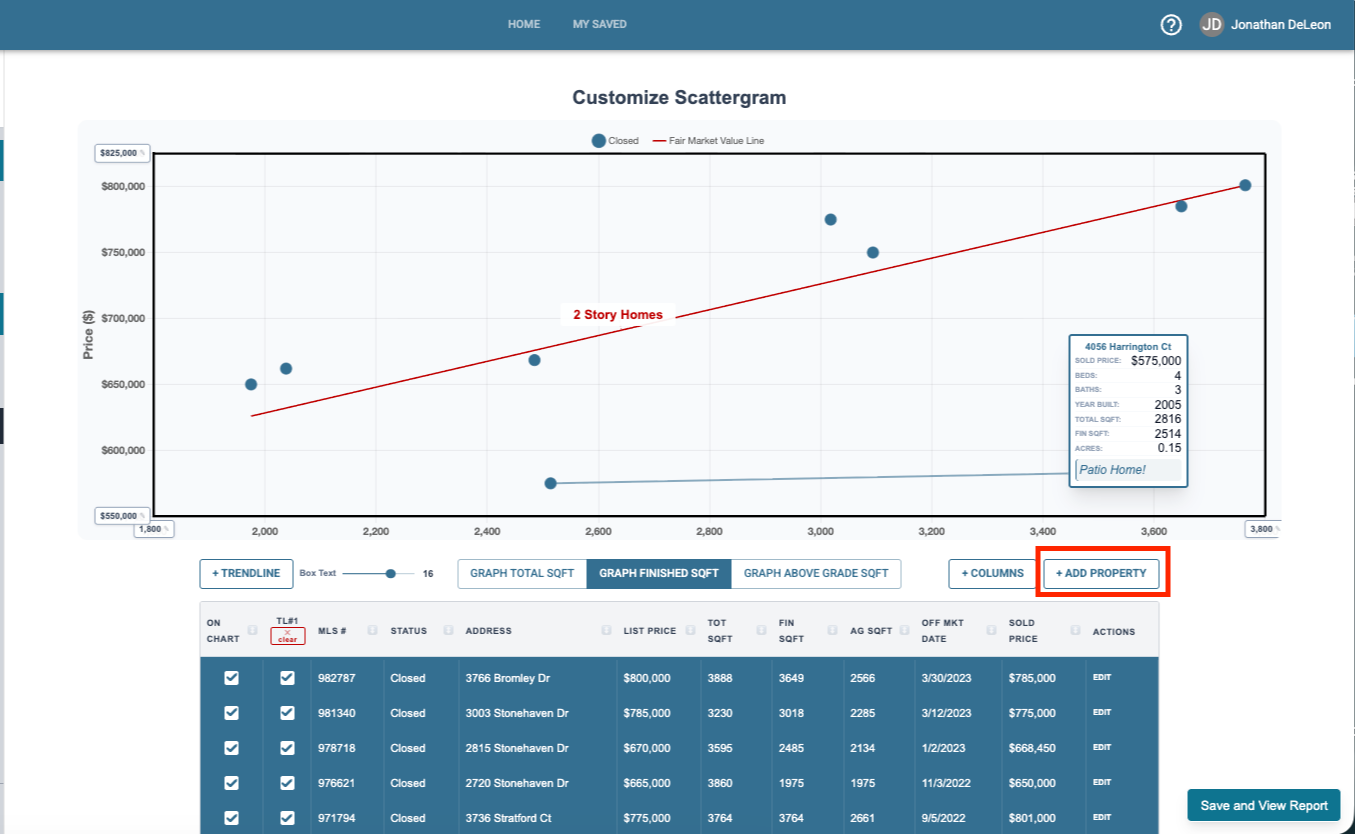
To add a property that is not currently on the data sheet click the + Add Property button.
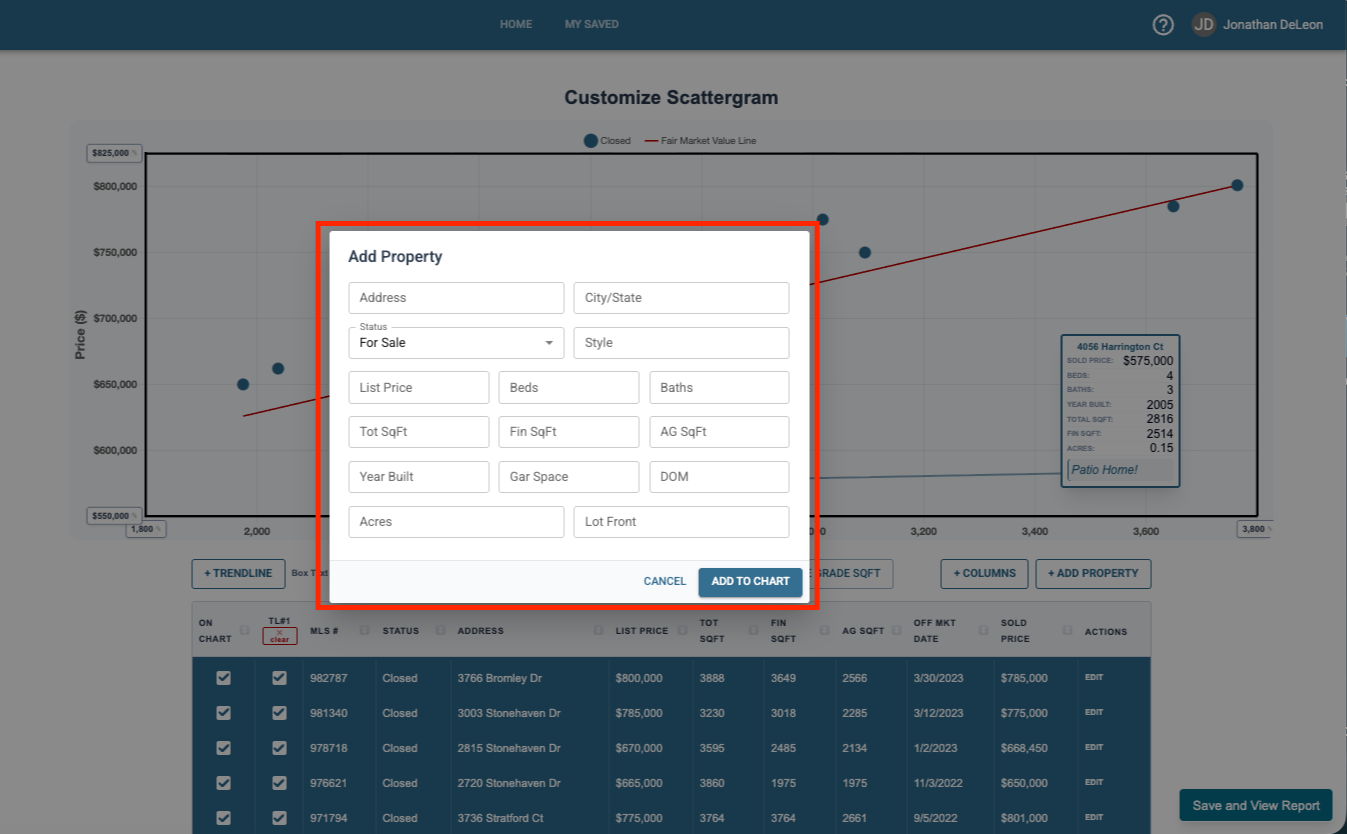
Fill in the needed information and click Add to Chart.
To sort the data sheet, click on the headers of any data point and it will sort by that detail.
The trend line by standard is made up of all the sold properties represented on the graph. However you can opt some properties out by unchecking the TL#1 box.
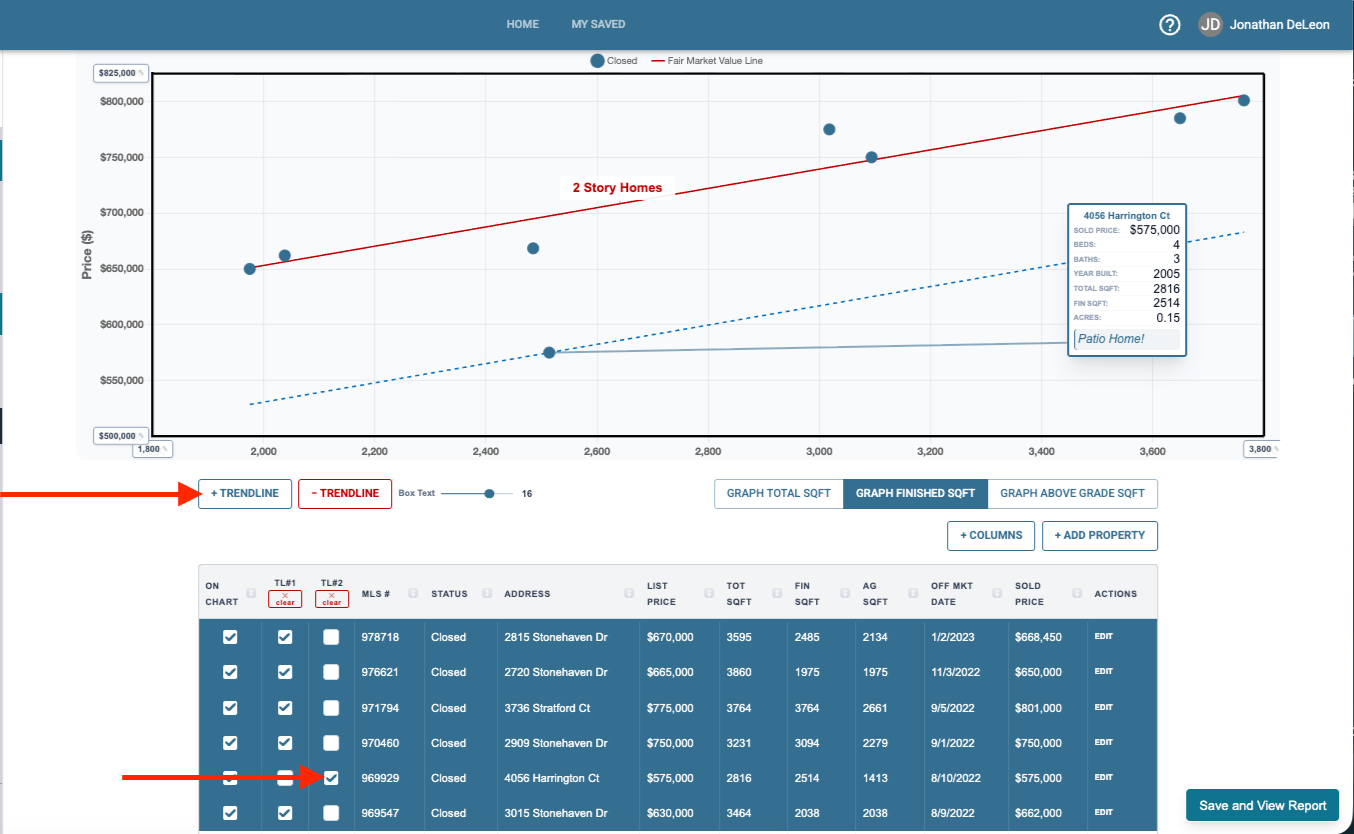
You can also add a second trend line and add properties to that trend line by clicking the +Trend line button then using those check boxes on the new TL#2 column.
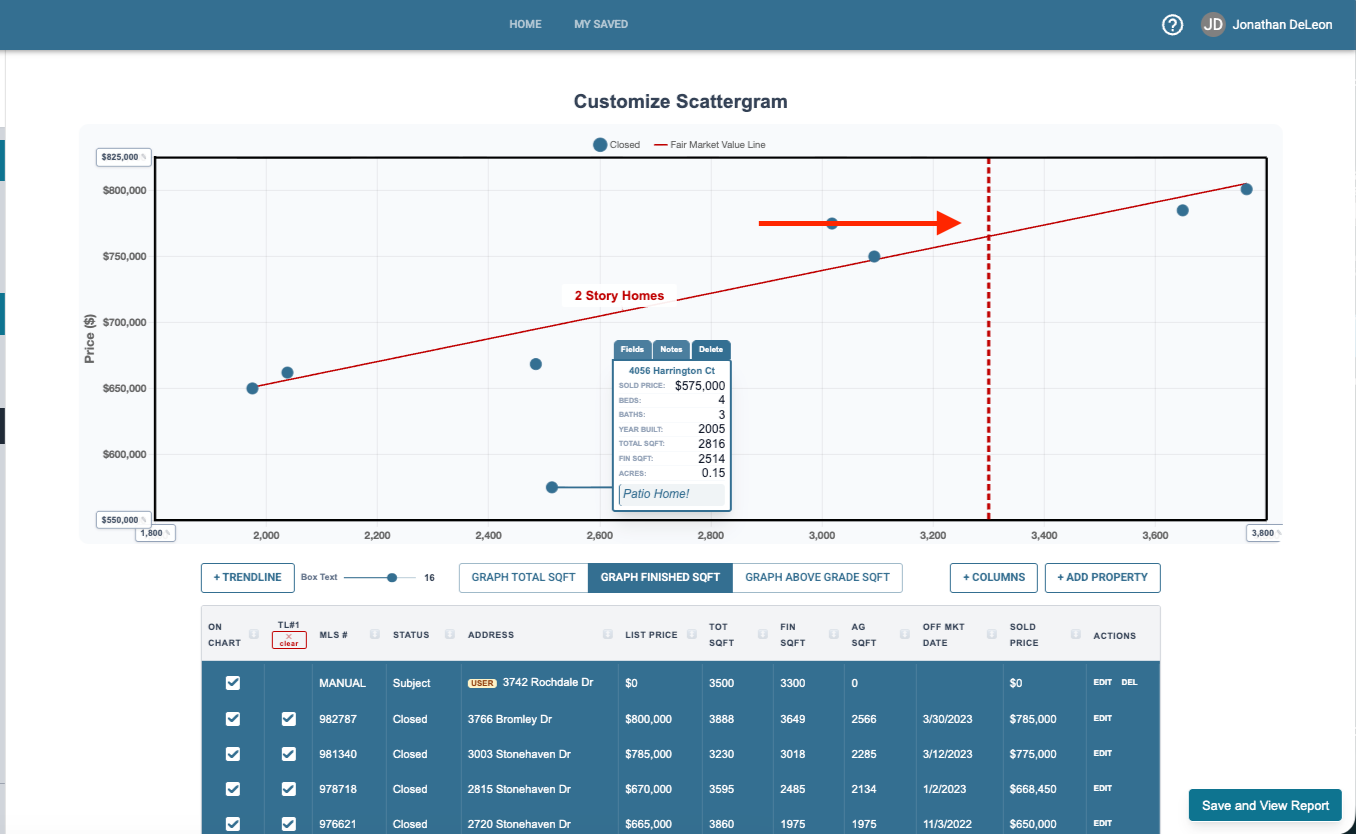
As you are using this graph to look at the value of your subject property there is a special option with subject properties you add to the graph. When you add a subject property you’ll see a line leading from the square footage up to the trend line. Do this by adding a subject property through the +Add Property button, and input the size of the home but not putting a sold price as it hasn’t sold yet. Your graph will look like this.
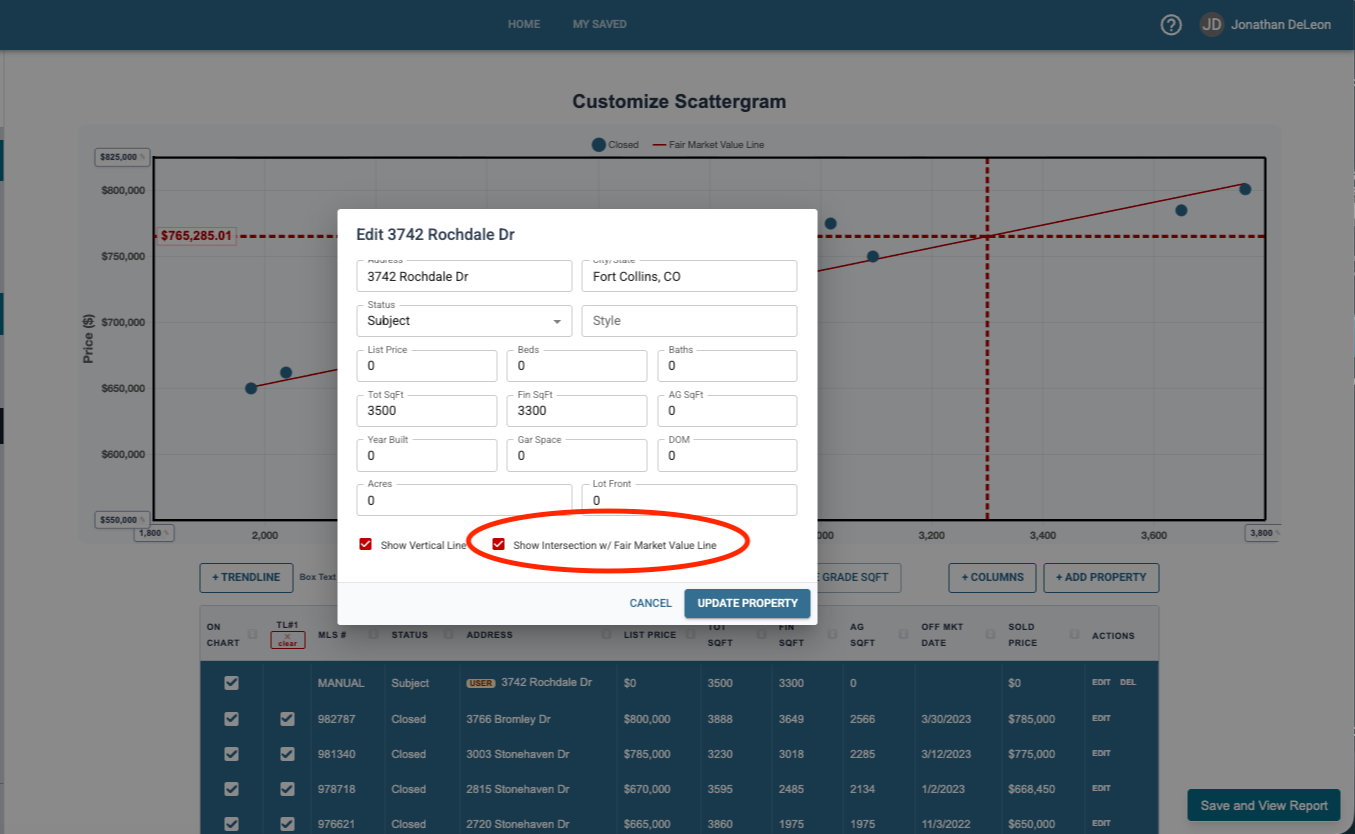
If you don’t see this line click Edit and ensure this option is checked.
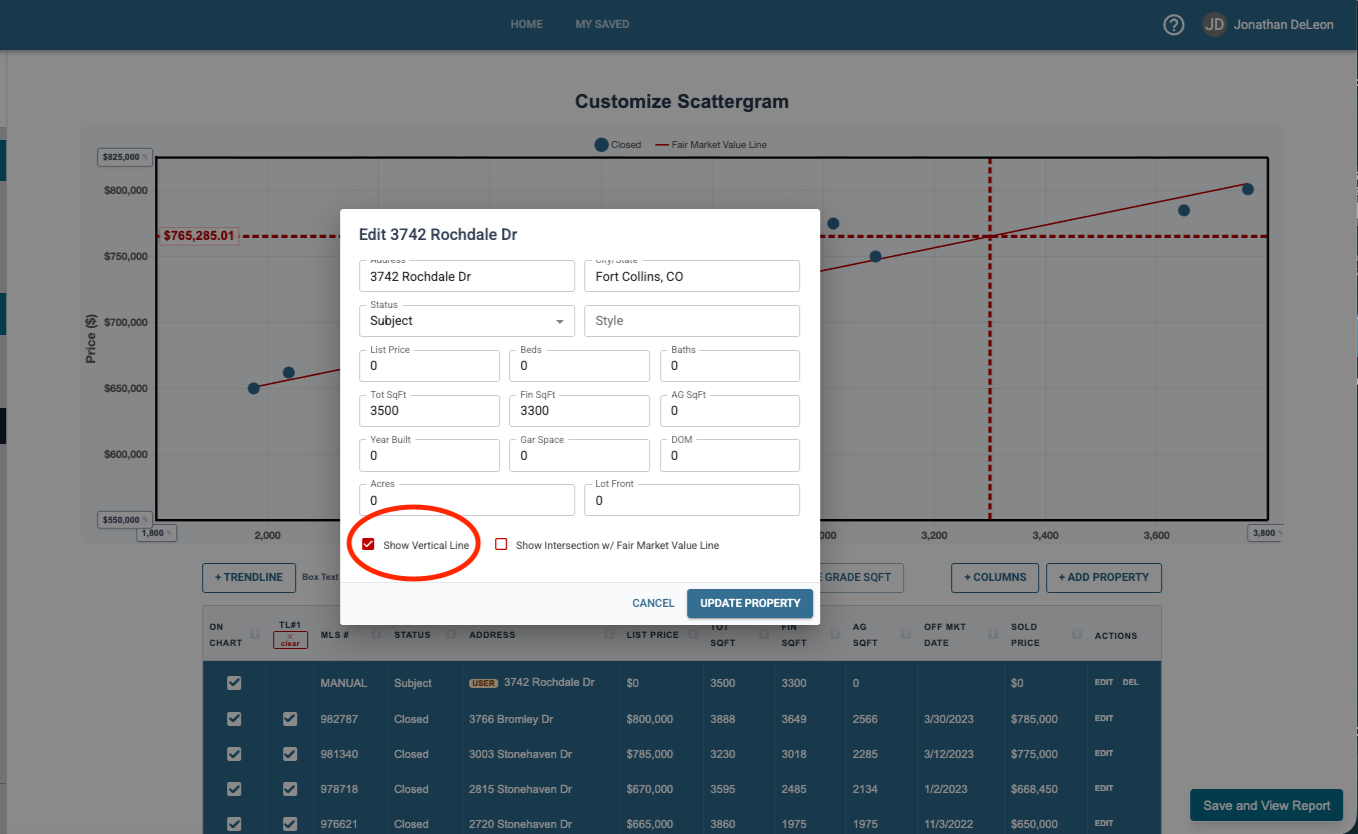
You may also want to enable the Show Intersection to see what value the home is matching up to. Enable it first and your graph will have a new line and information that shows you the estimated value based on sold properties