Help Center > Competitive Market Analysis > How to Customize Your Competitive Market Analysis Positioning Scattergram
How to Customize Your Competitive Market Analysis Positioning Scattergram
Like the Pricing Scattergram the Positioning Scattergram uses the concept of three main control areas. There are some differences in the standard settings but overall the controls run the same.
They are divided into (3) main areas: X-Axis Variable Options, On Graph Controls and Data Sheet Controls.
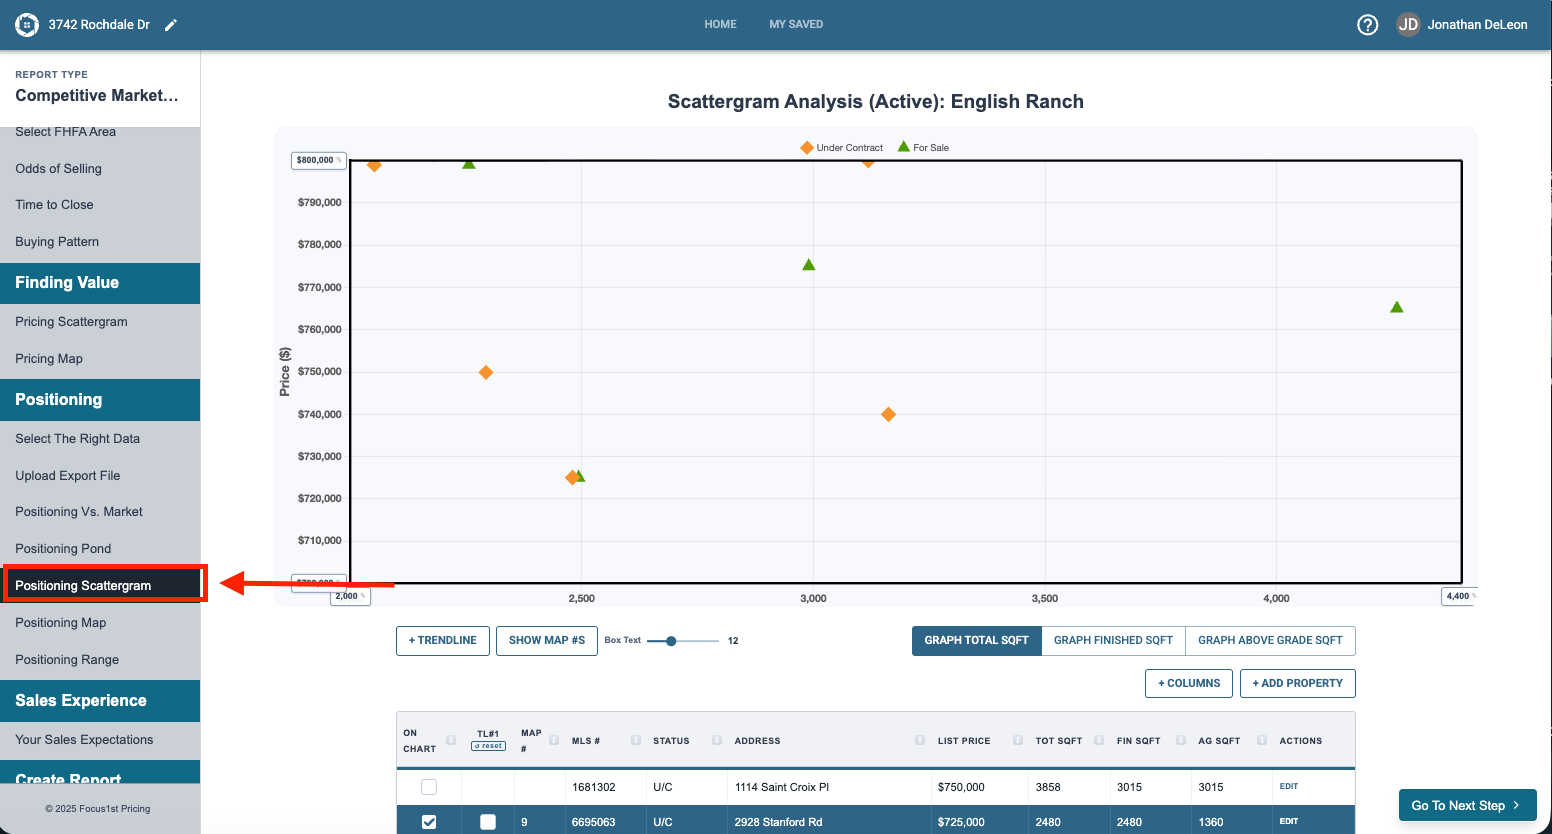
To use them first you’ll need to open the Positioning Scattergram Step on the sidebar.
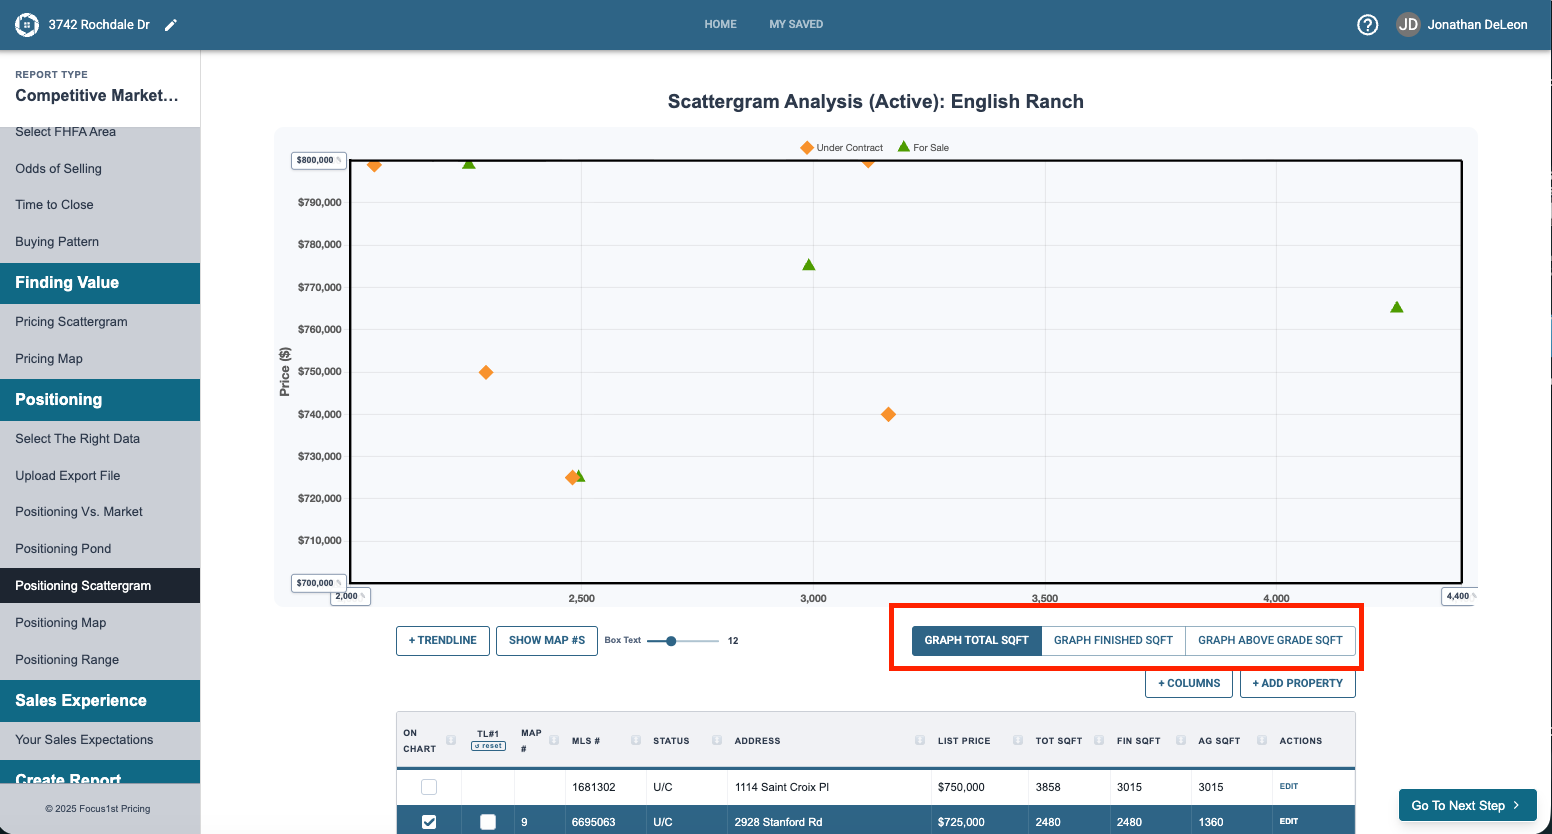
If you want to change the X-Axis you can do so by clicking any of the buttons showing the variables below.
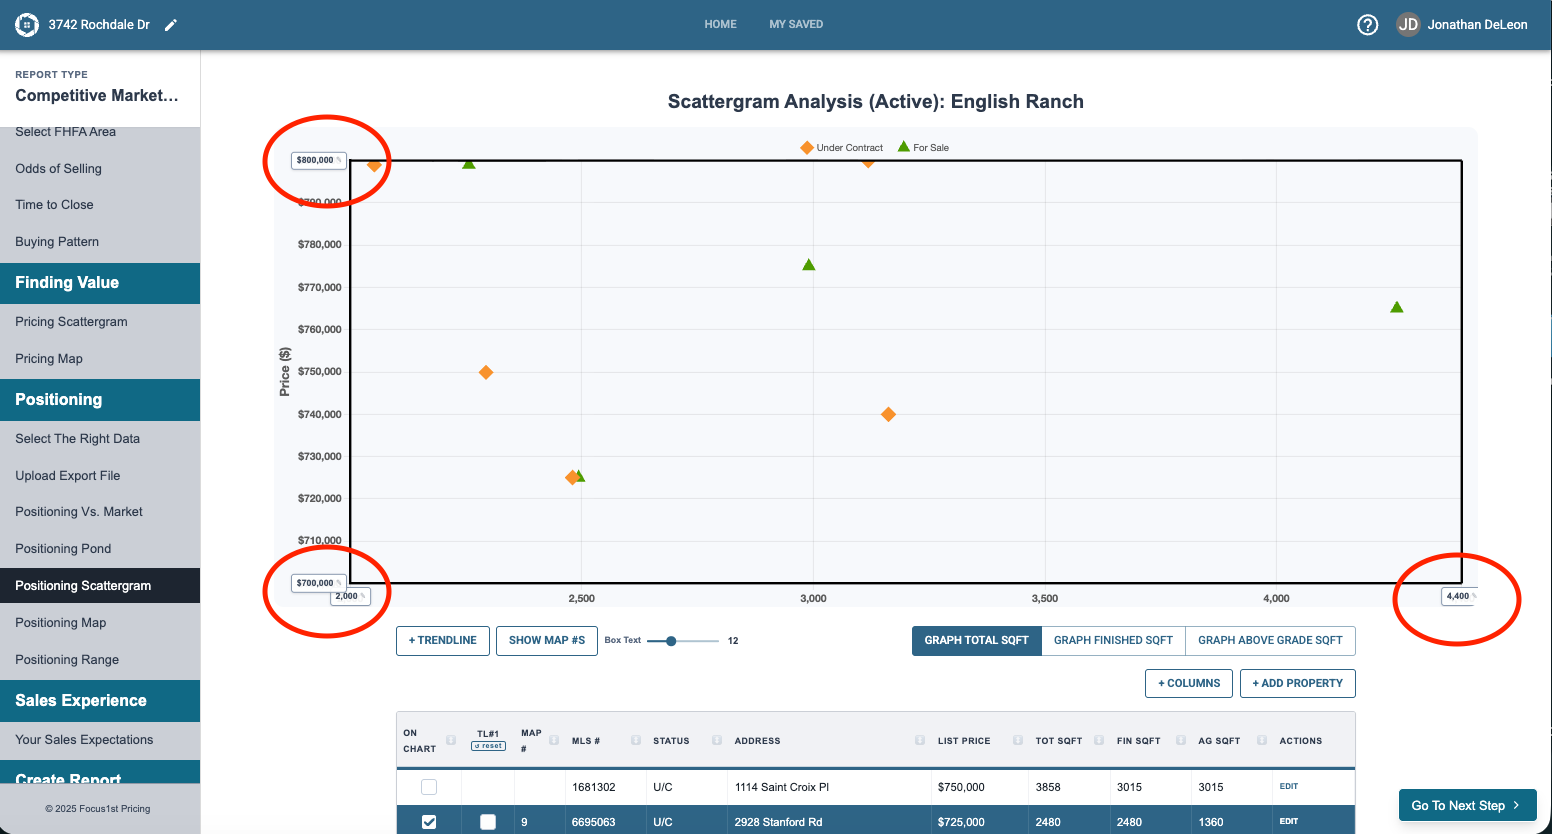
The on graph controls allow you to do a number of things to add detail as well as control the scope and size of the graph itself.
On the top left, bottom left and bottom right corners you’ll see boxes you can type in to manually scale the graph.
Scattergram Goal
Customize Scattergram
X-Axis Variable Options
On Graph Controls
Data Sheet Controls
Labelling Controls
Special Subject Property Option
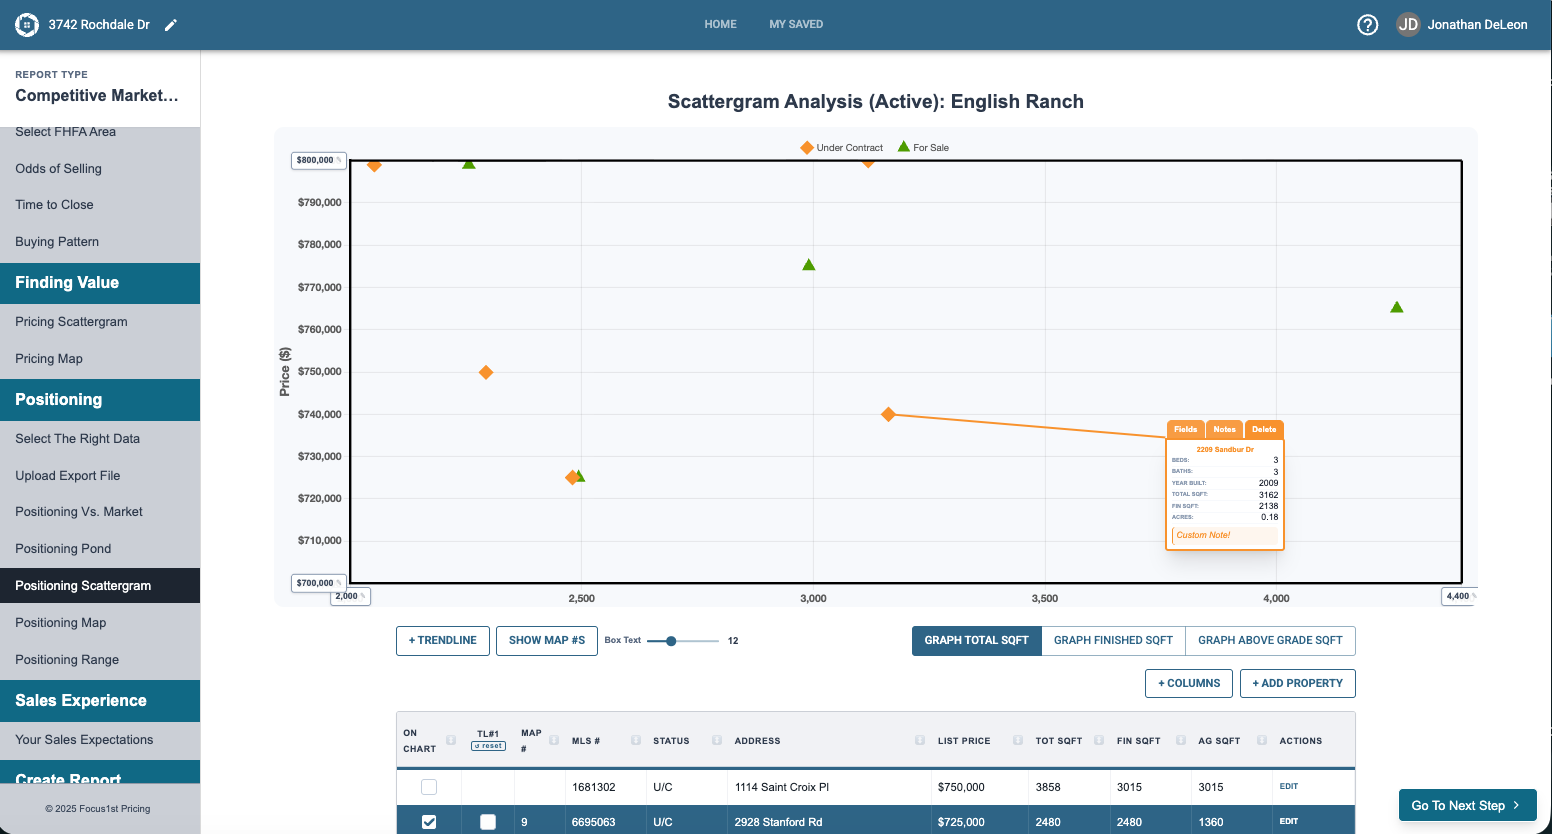
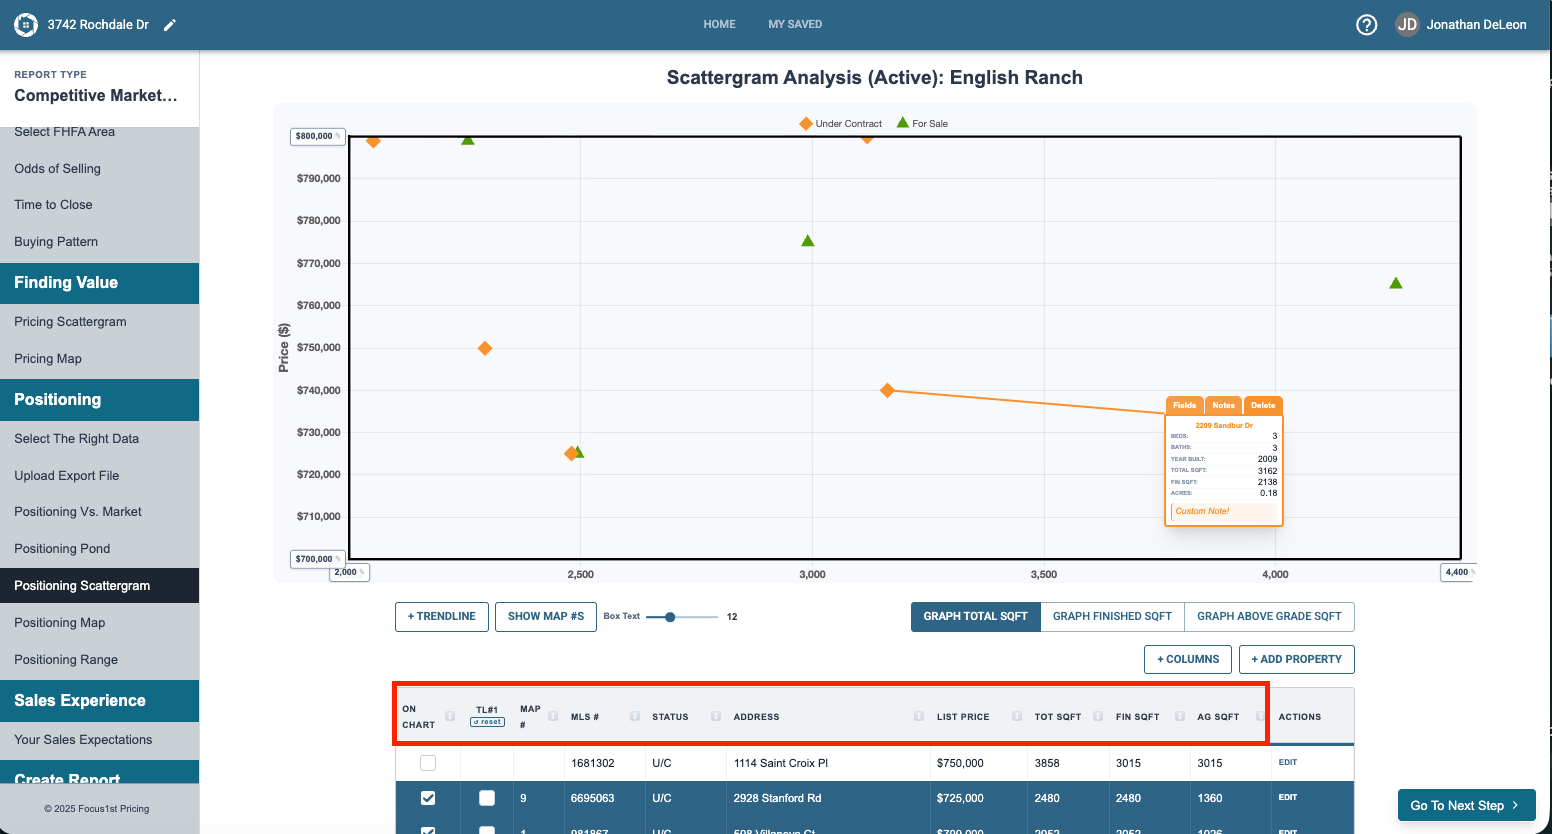
You can add textboxes to any property dot by clicking on it.
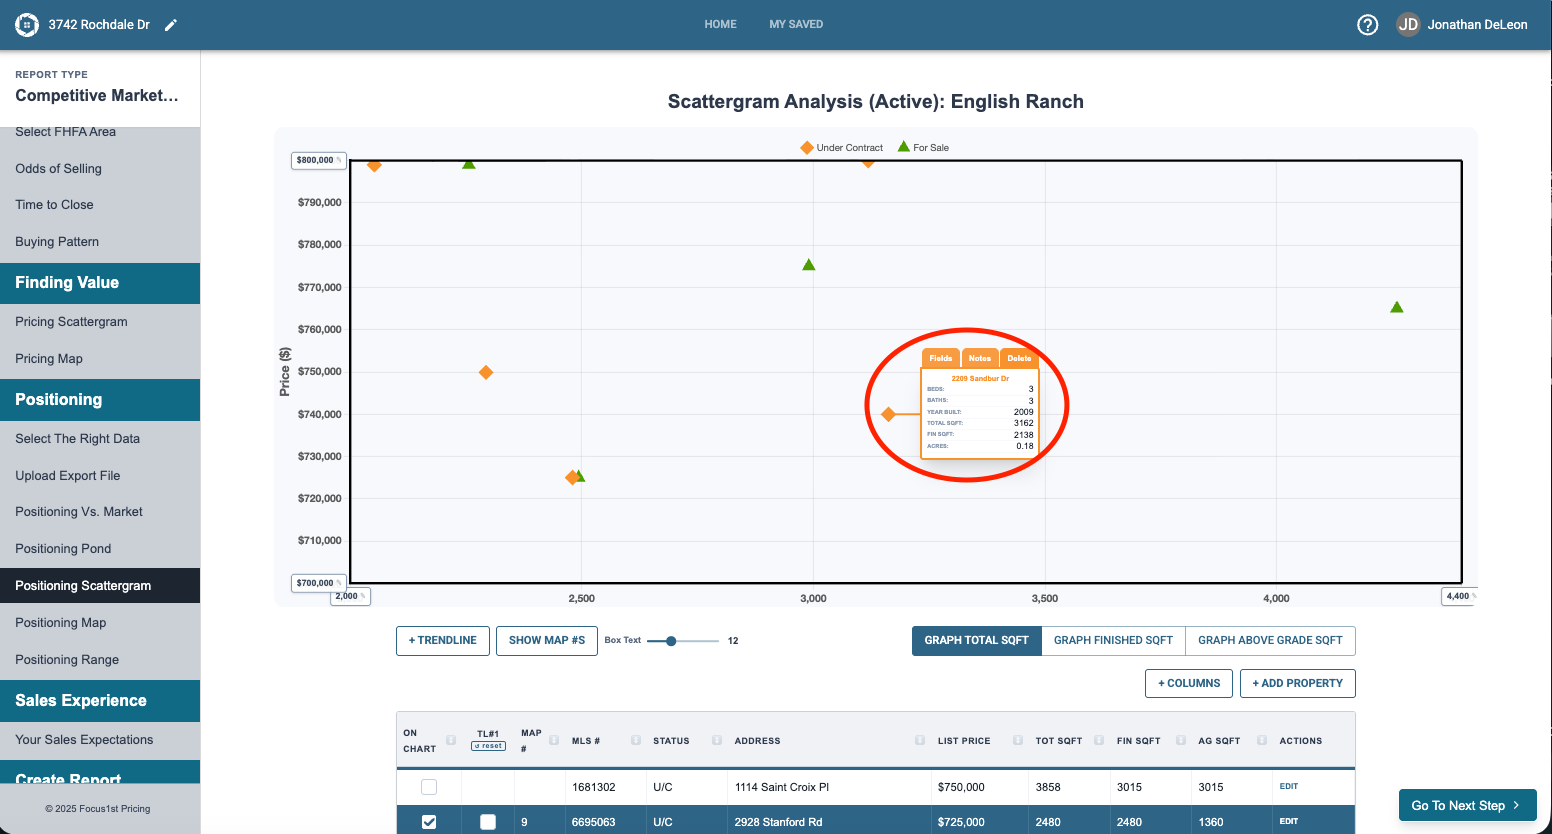
When selected each textbox has three tabs.
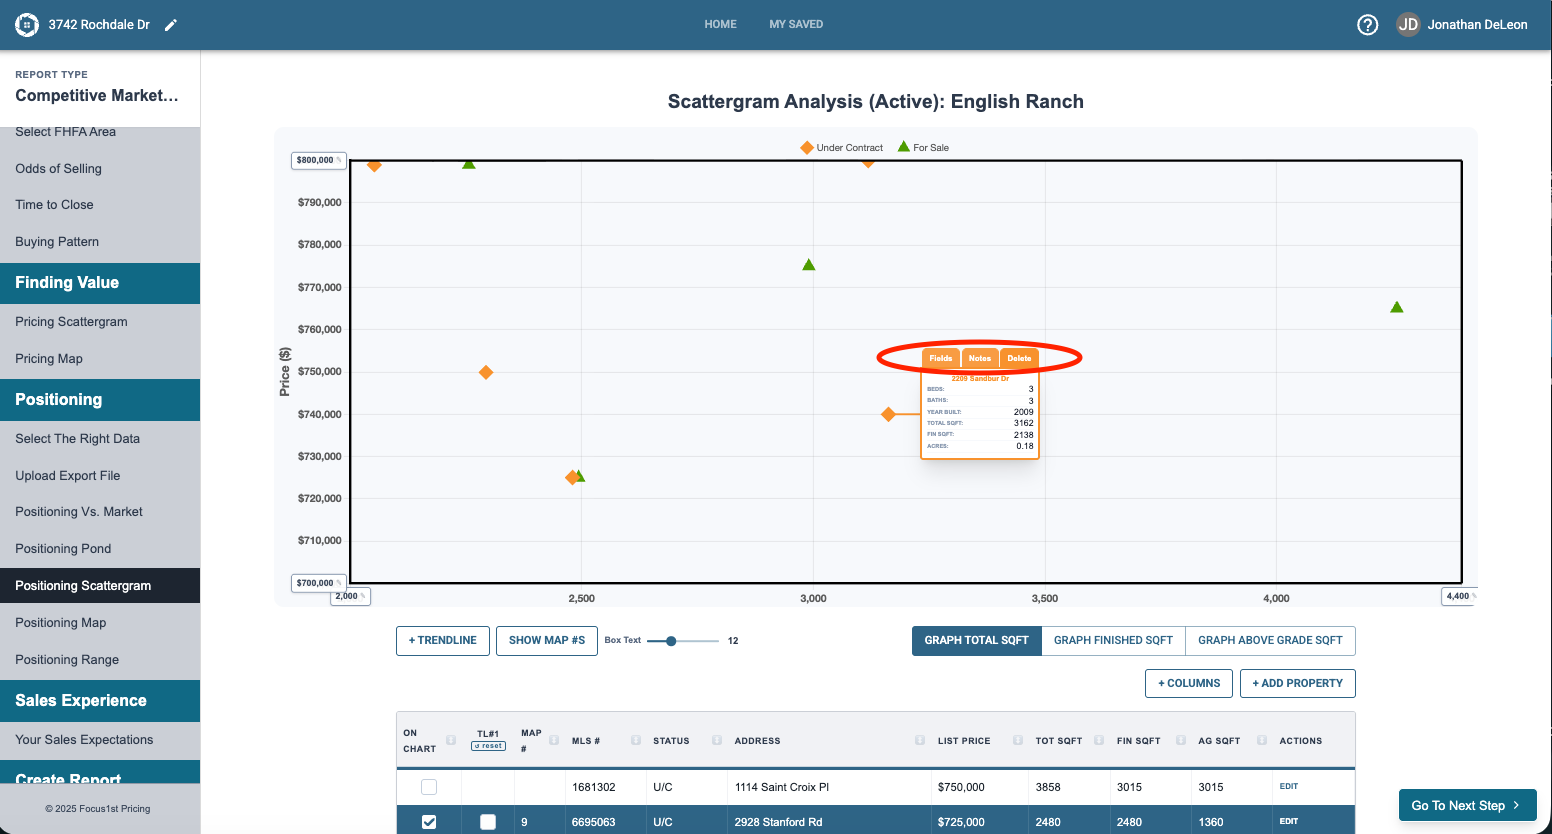
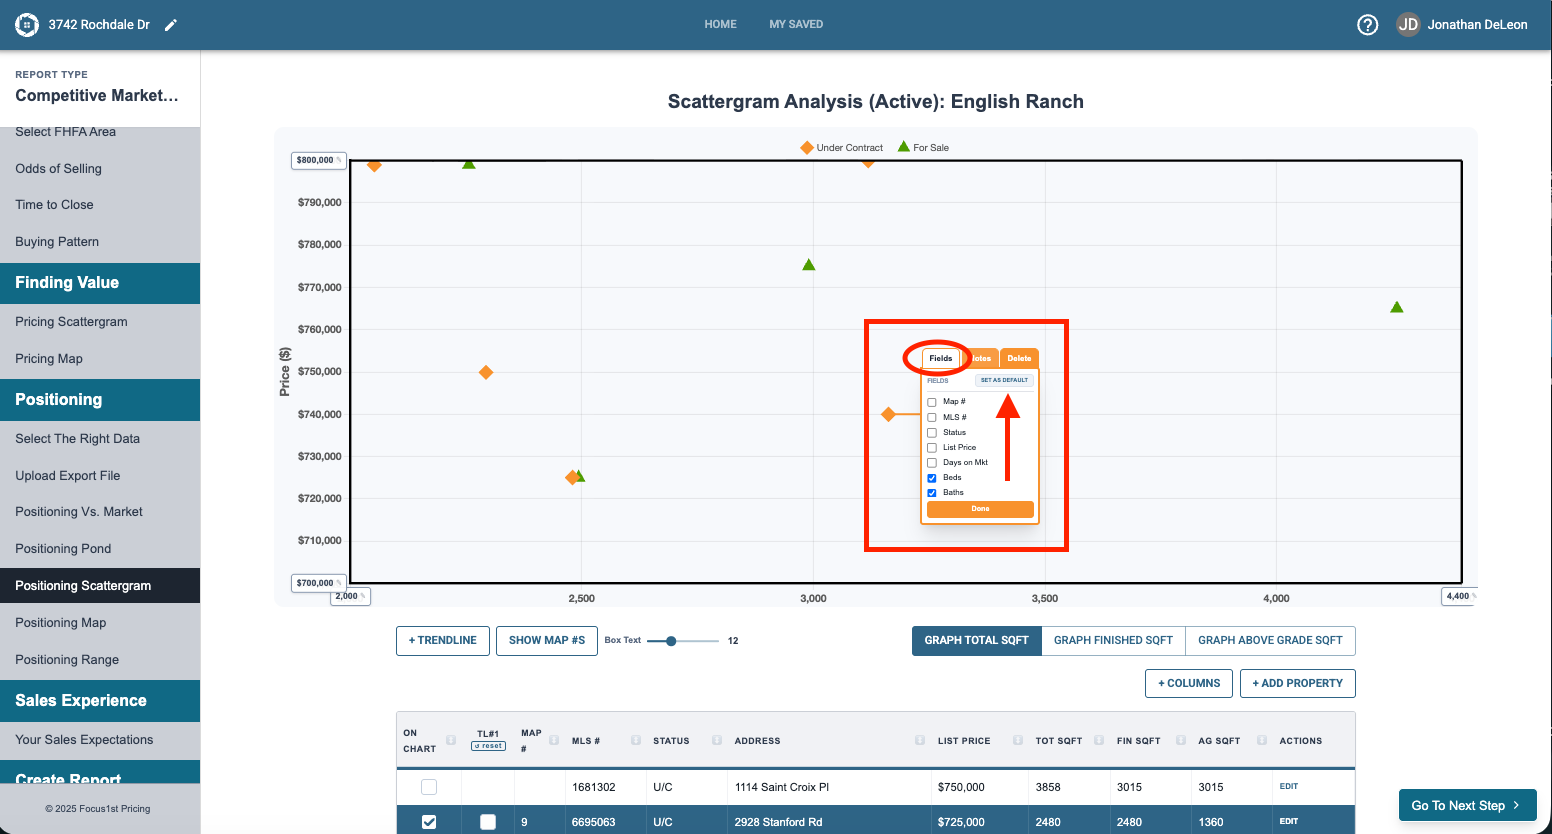
Fields lets you select which fields from the data are brought up into that box. You can also save you desired default fields here.
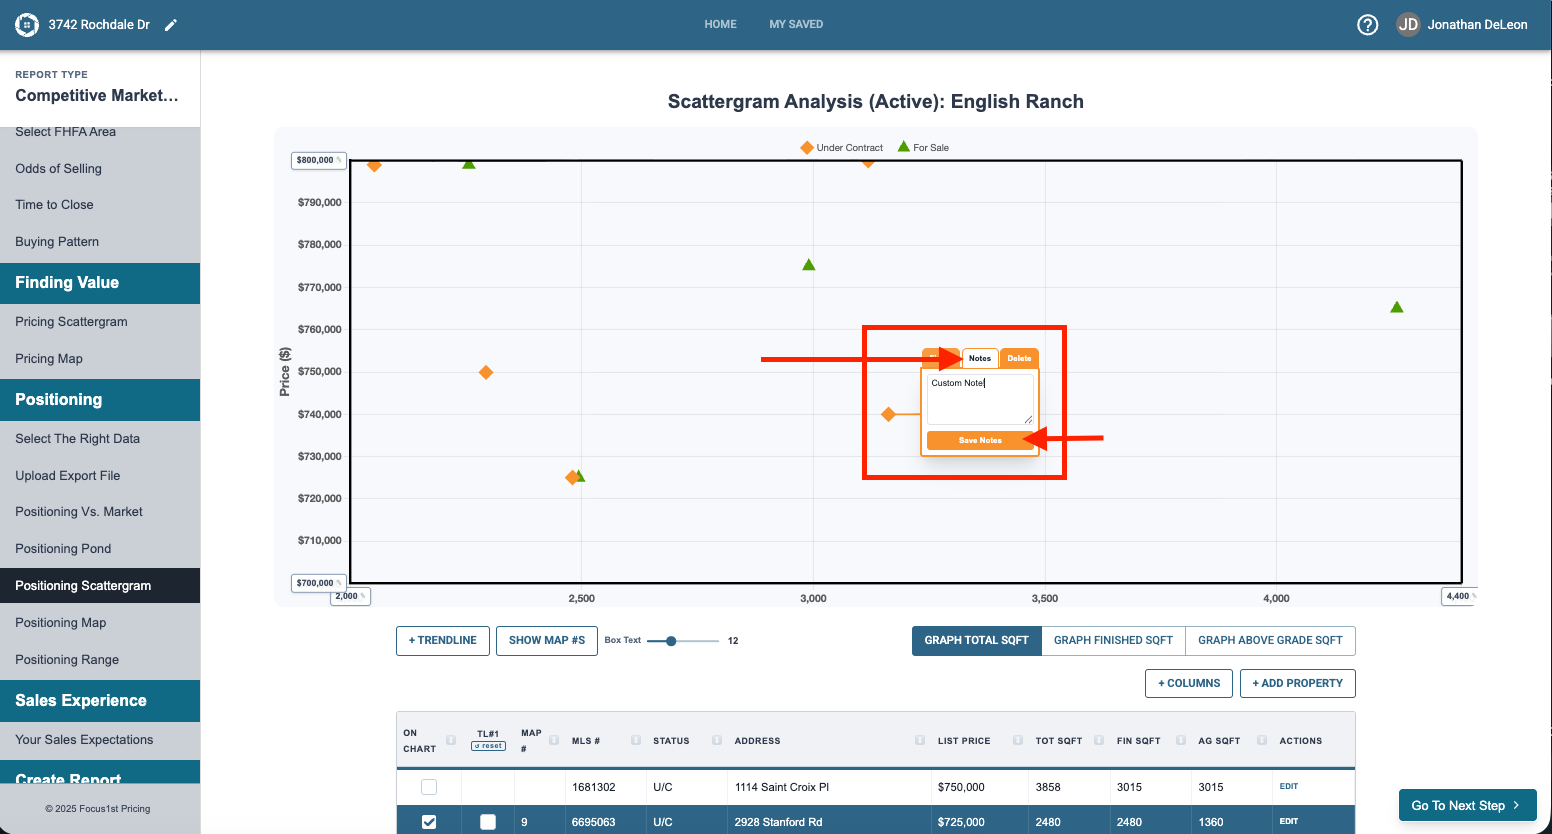
Notes lets you type in custom information that shows at the bottom of the text box.
Delete removes the text box from the graph.
All text boxes can be moved by clicking and dragging them to your desired position. You’ll see the line move with the text box so it still stays connected with the property.
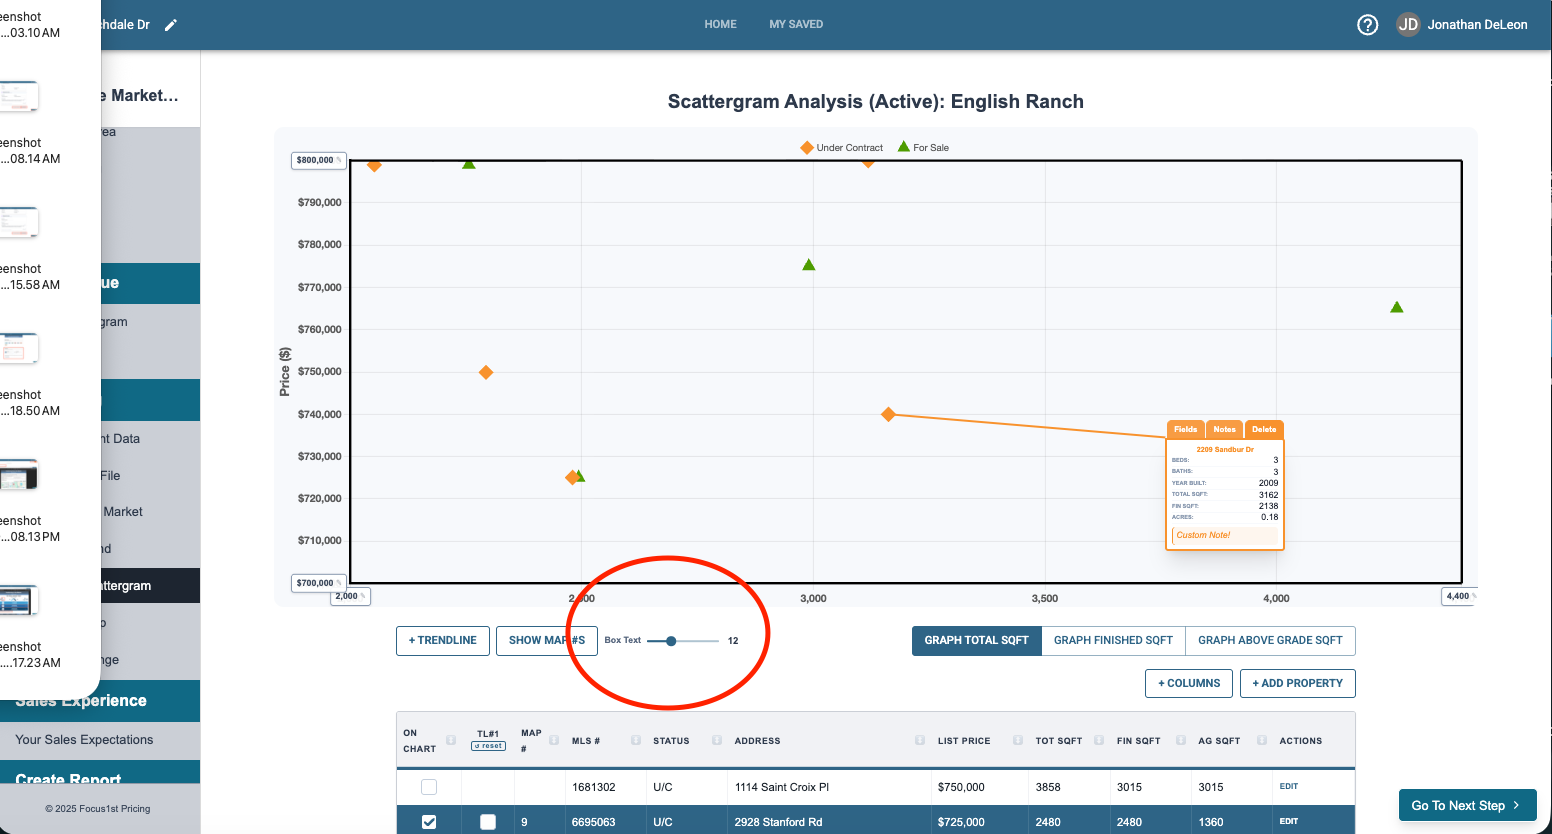
You can adjust the size of the text in the textboxes using the slider bar below the graph.
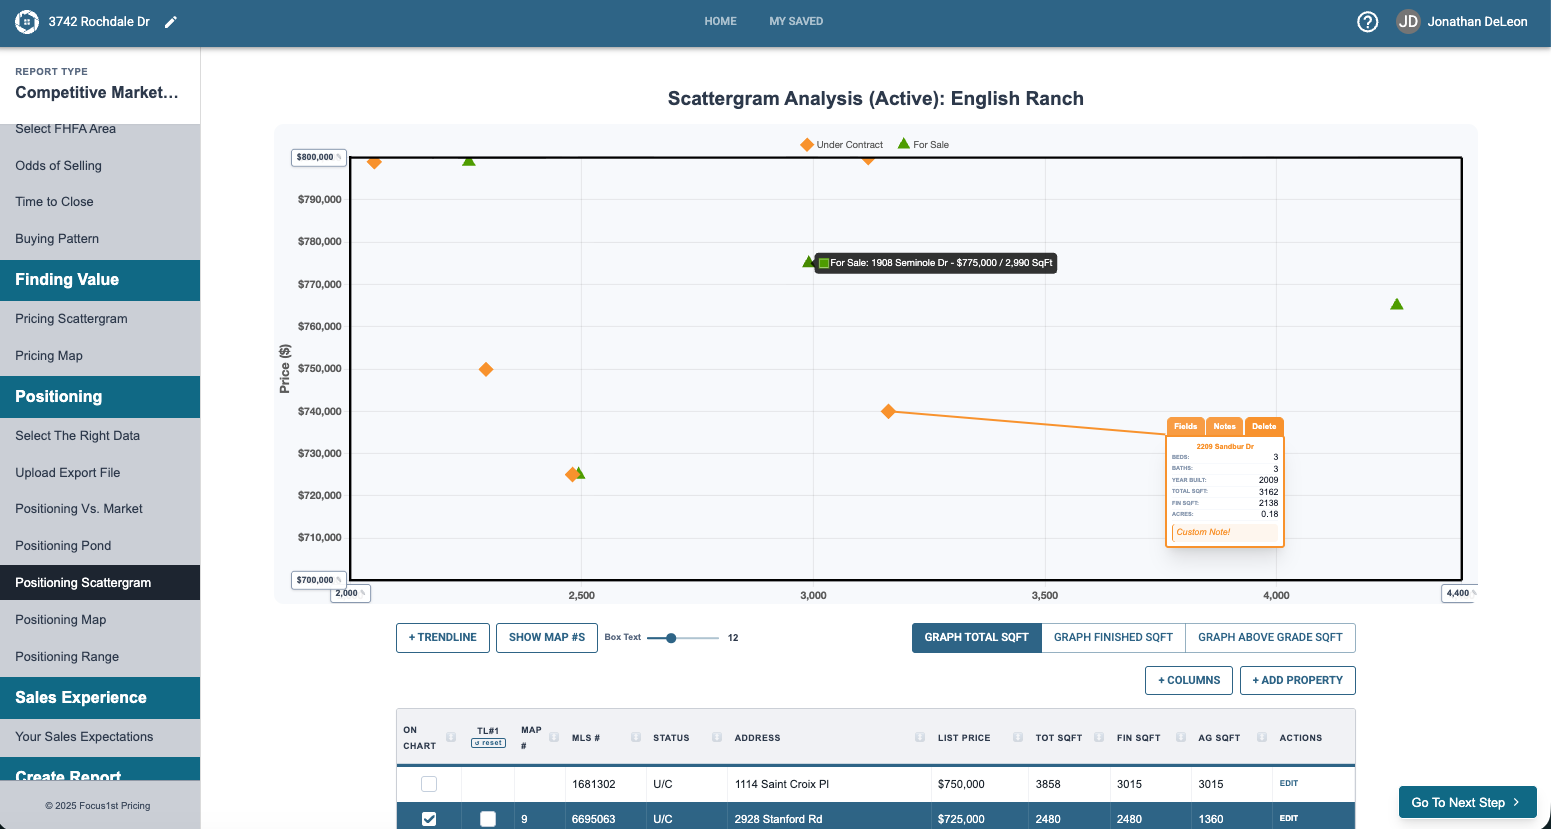
You can also simply hover over a dot to inspect the address and price.
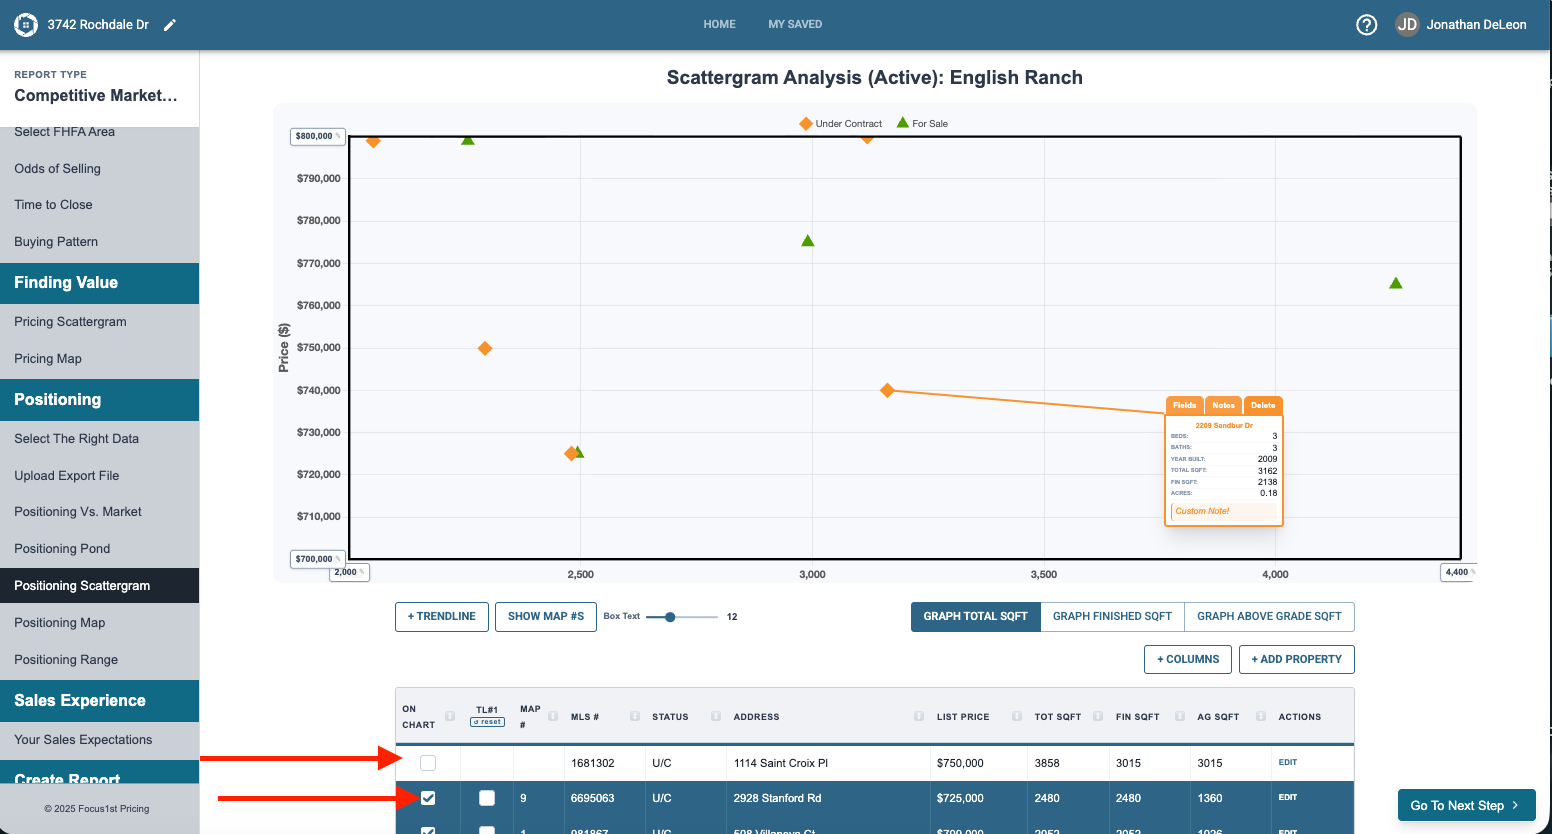
The data sheet controls let you control the properties represented on the graph.
To include a property click on the property below to turn it blue. You’ll now see it on the graph. To remove it, click again and it will turn white and no longer be on the graph.
To edit any details on the data sheet, click the edit button to the side of the property.
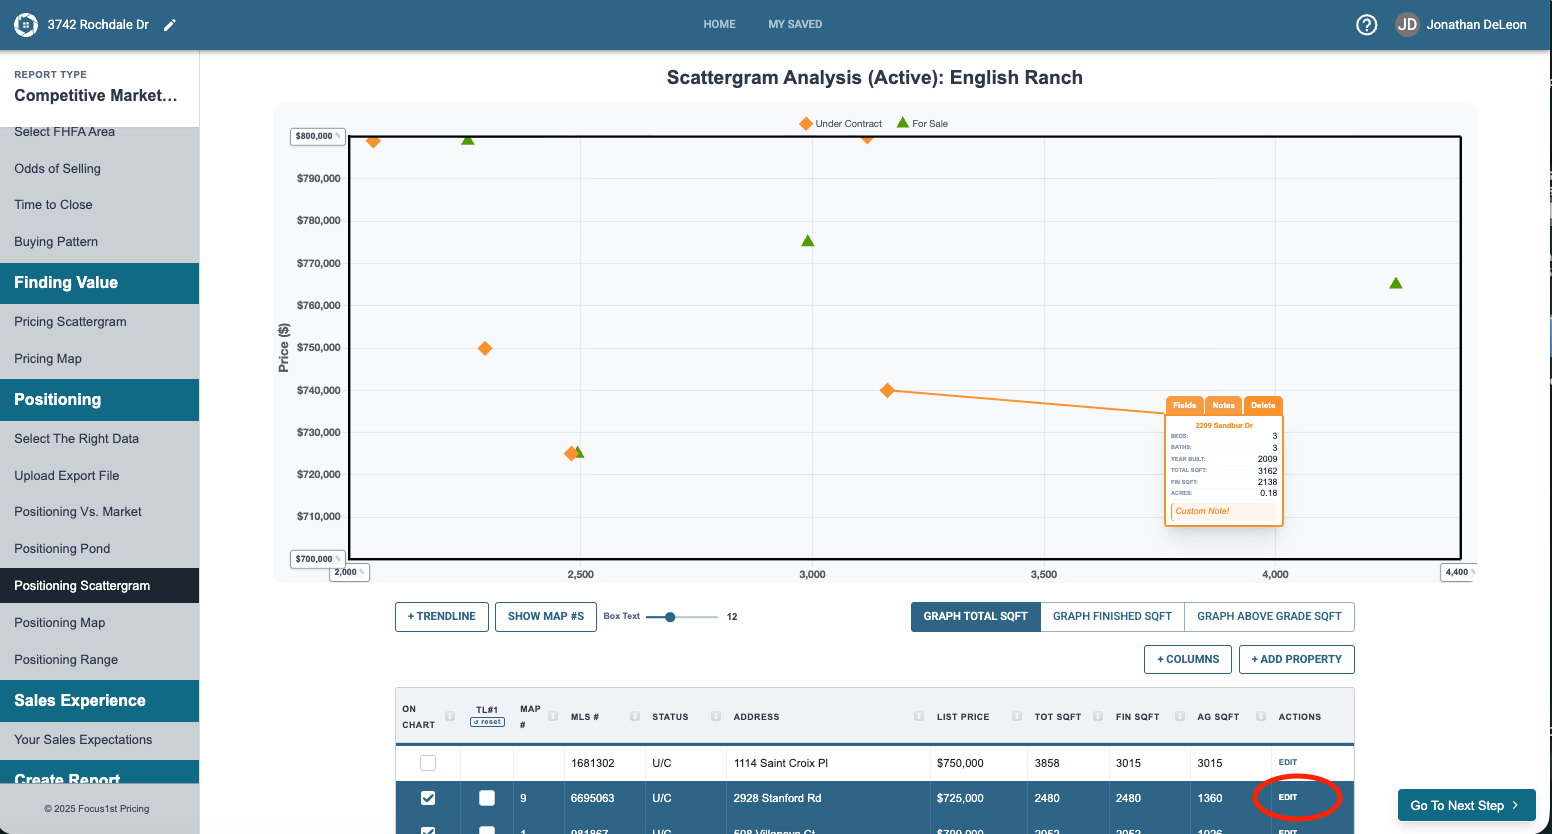
Type in any changes and click Update Property on the window that pops up.

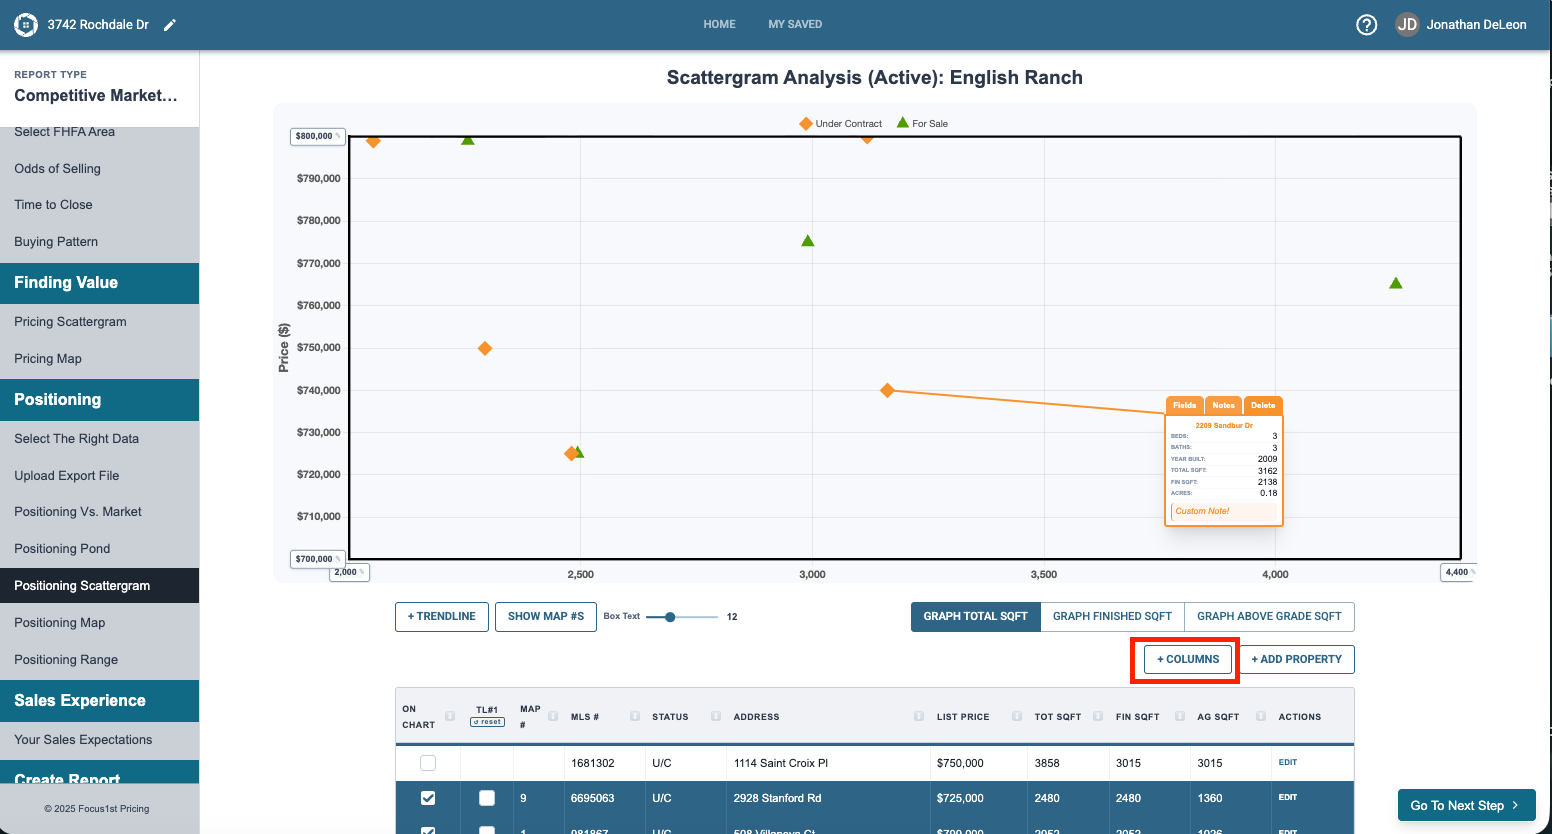
Not all the data that the program has shows in the columns below. You can control which data you see by clicking the +Columns dropdown and selecting your data sheet view.
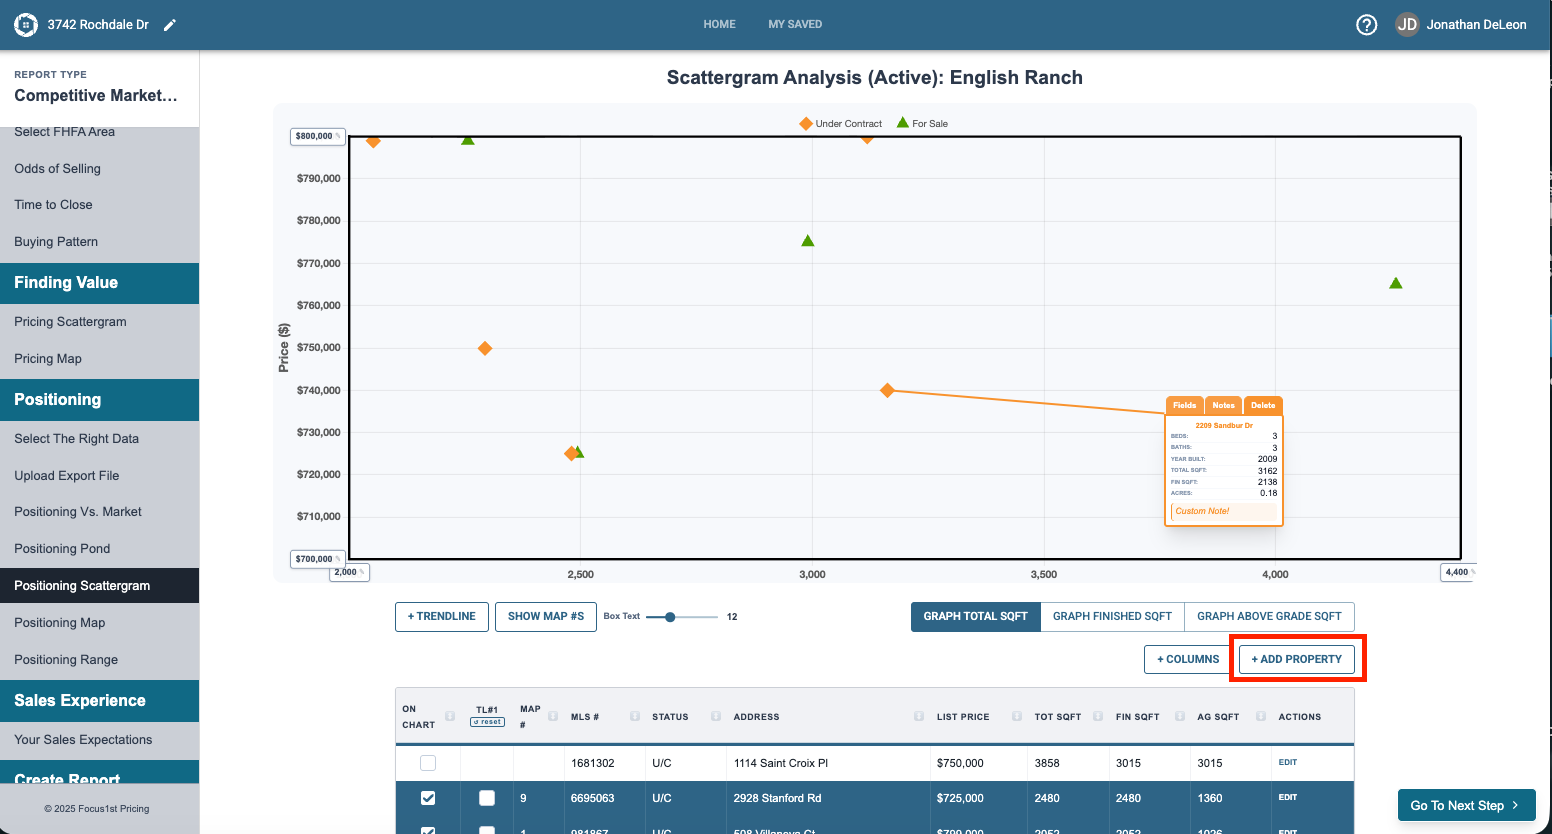
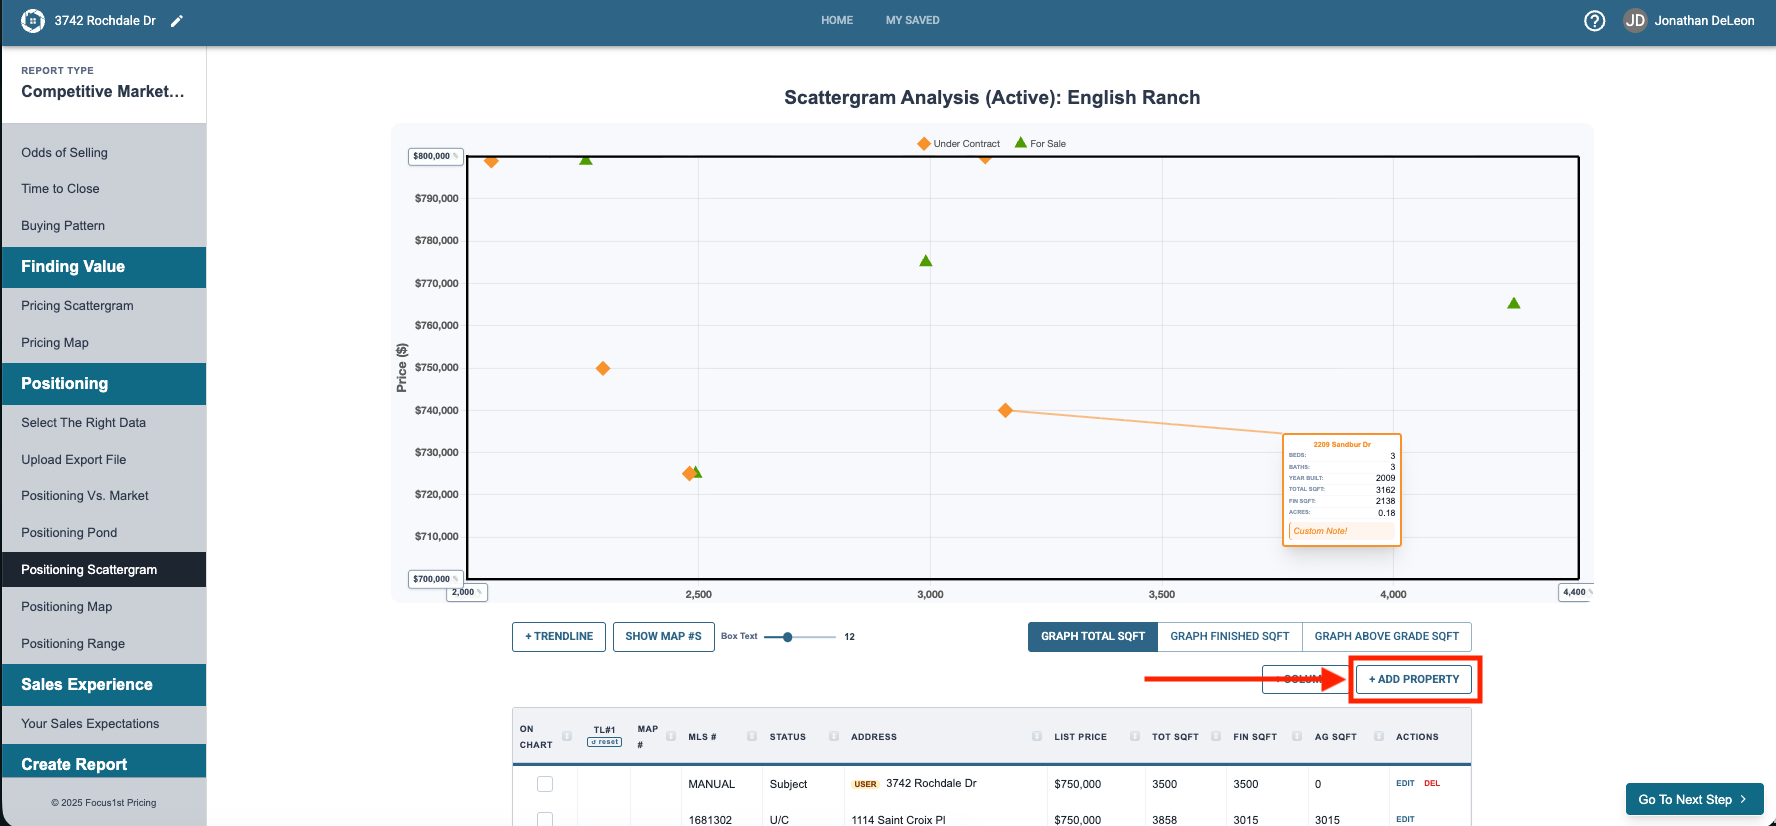
To add a property that is not currently on the data sheet click the + Add Property button.
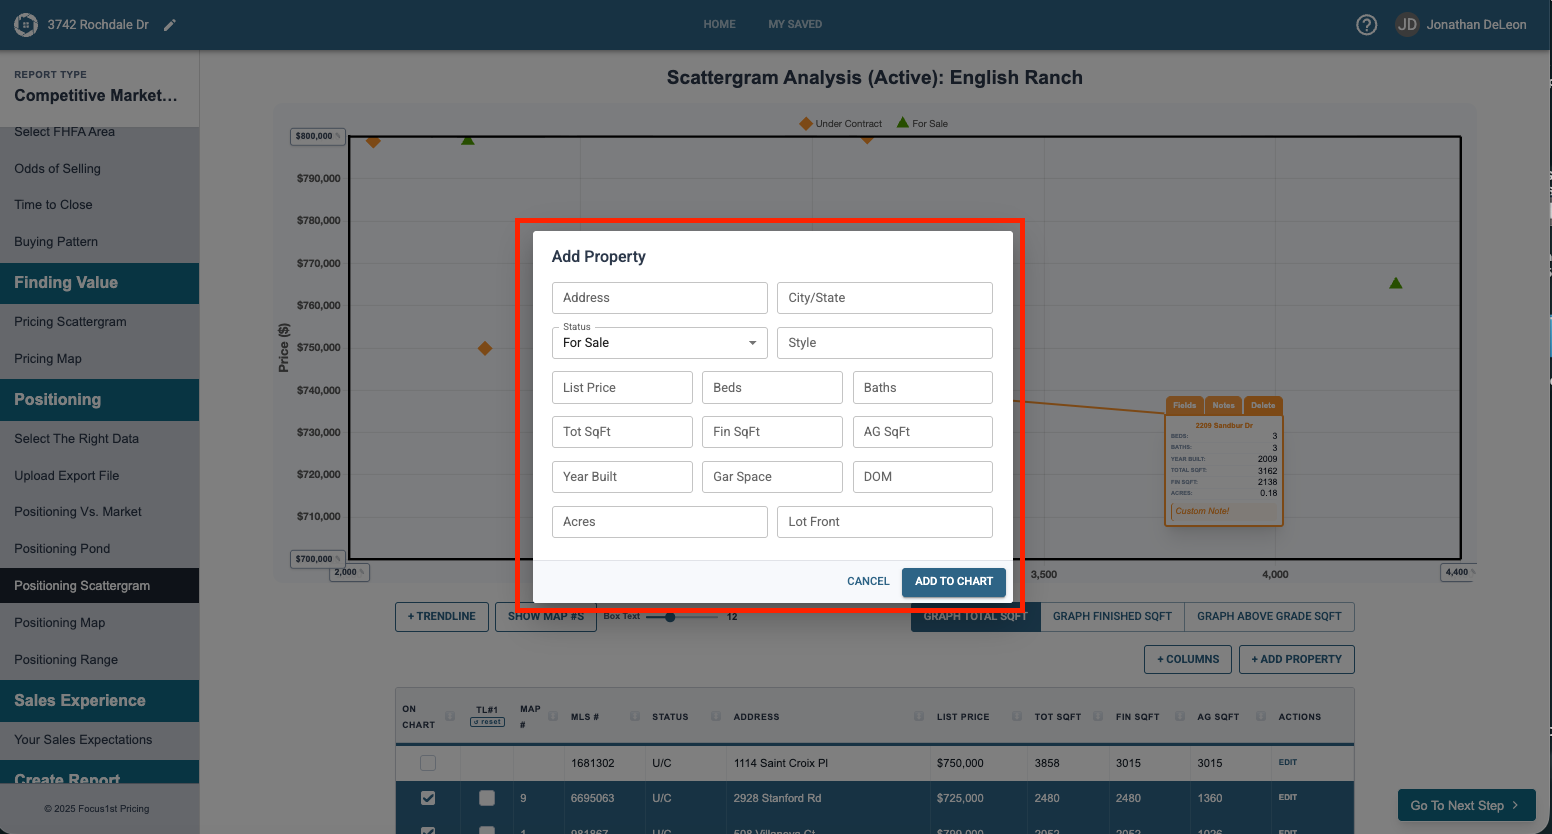
Fill in the needed information and click Add to Chart.
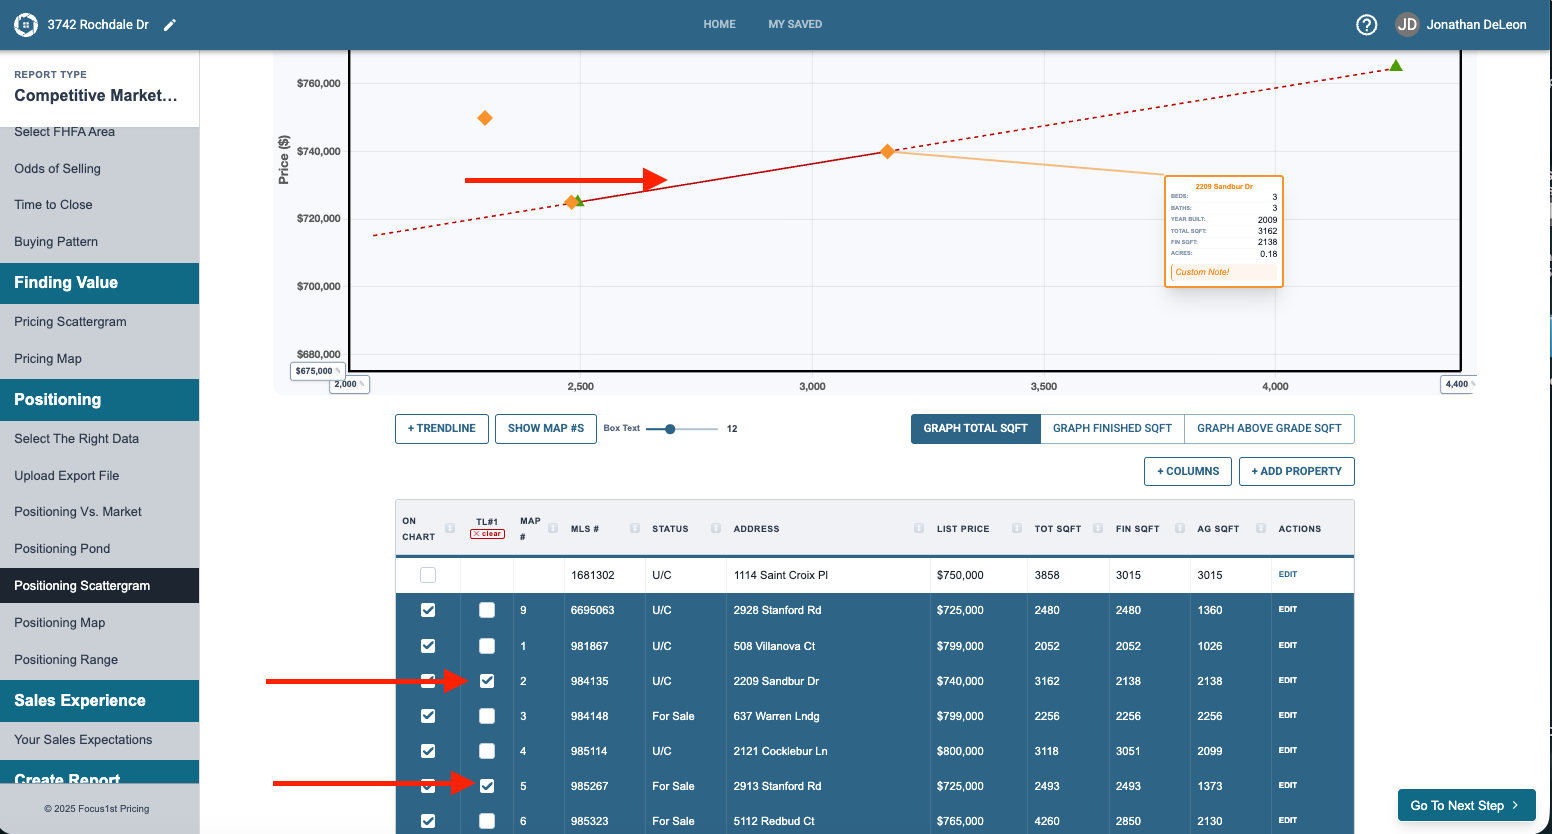
To sort the data sheet, click on the headers of any data point and it will sort by that detail.
In positioning there is often not a trend line used, however at times you may want to have one for under contract properties etc… to add properties to a trend line click the check box in the data sheet.
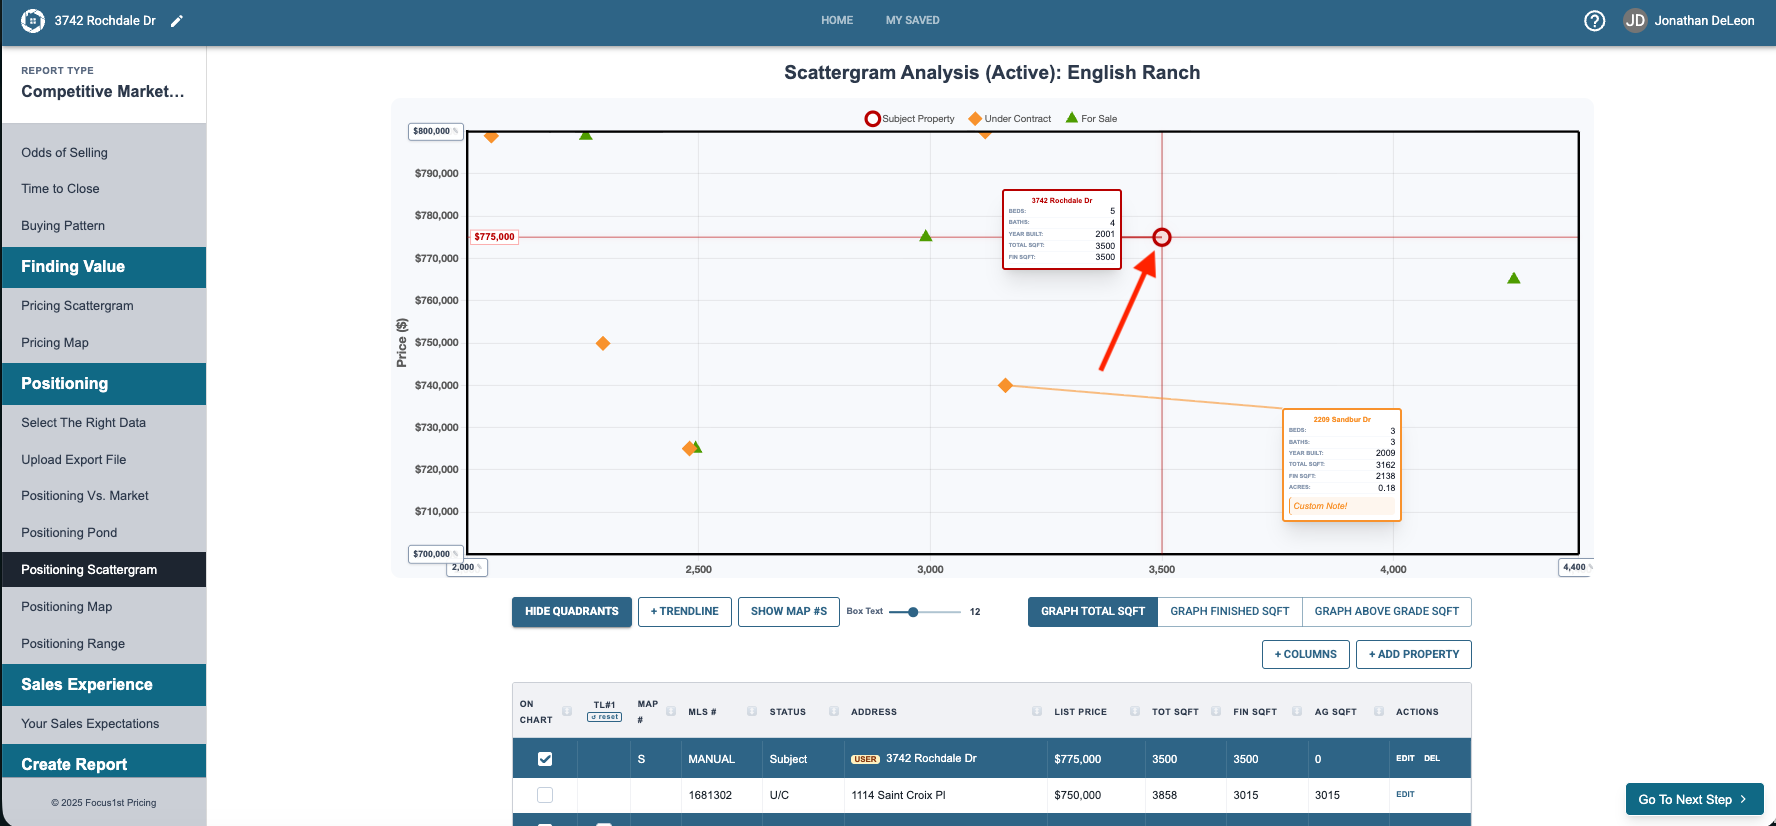
The Positioning Scattergram is used to establish the market value and where you need to price to establish a competitive advantage. To do this the Subject Property addition has some extra features. First you’ll need to add a subject property using the +Add Property function.
Change the status to Subject and it will automatically fill many of the boxes. Finish filling out any that don’t pull in from the Report Details & Property Details Page information and we recommend to check both boxes at the bottom.
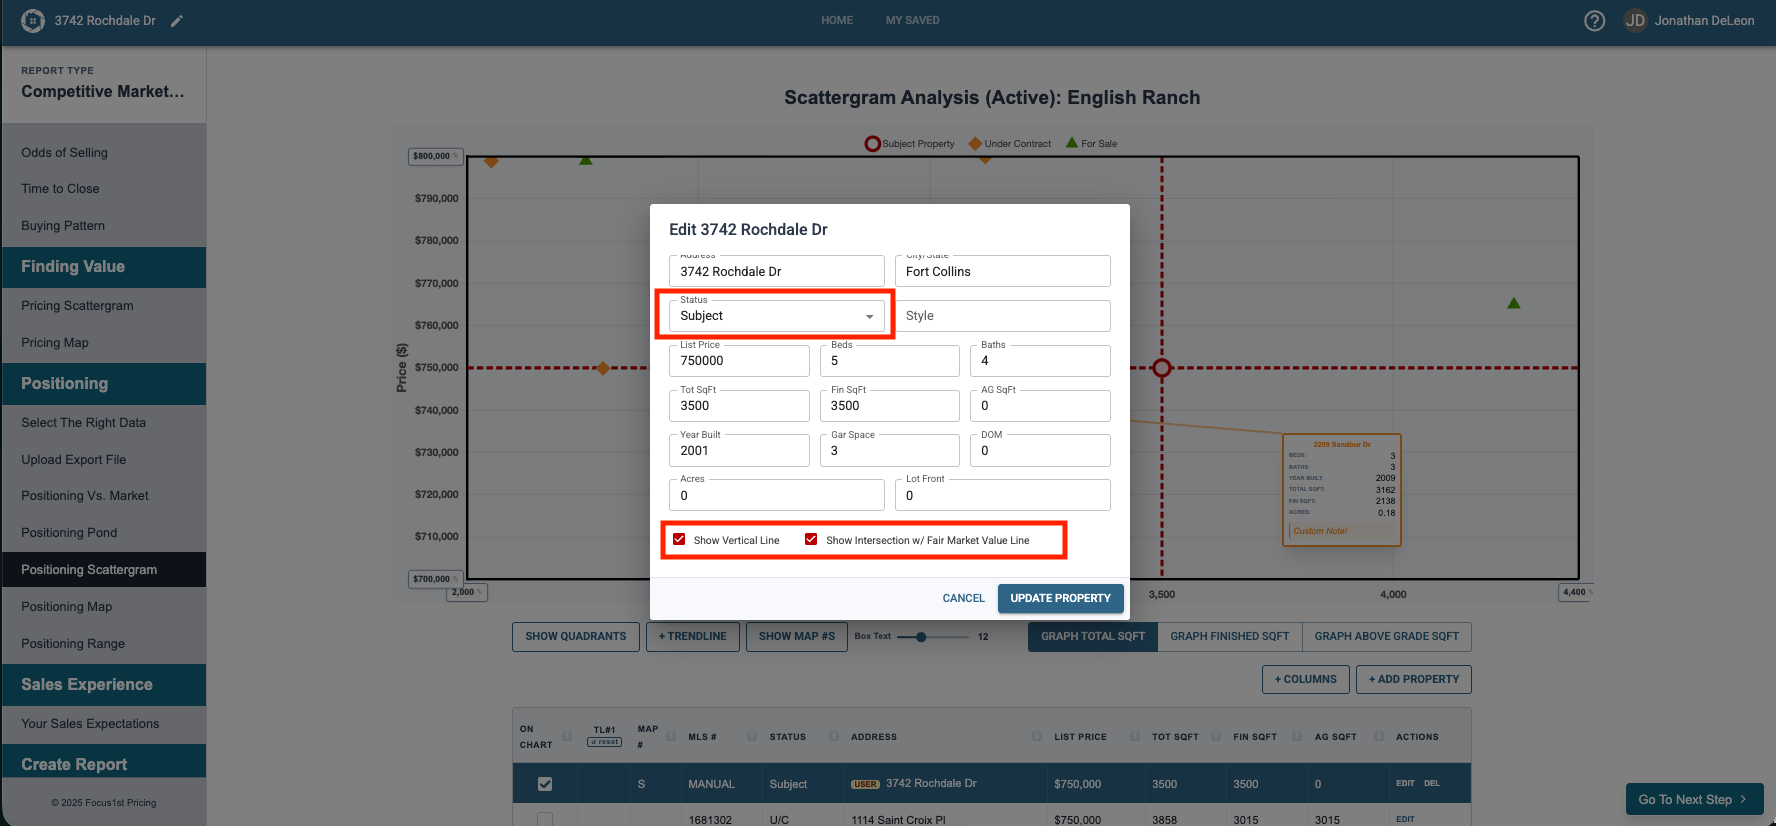
You will now see your Subject Property and it’s intersects on the Scattergram.
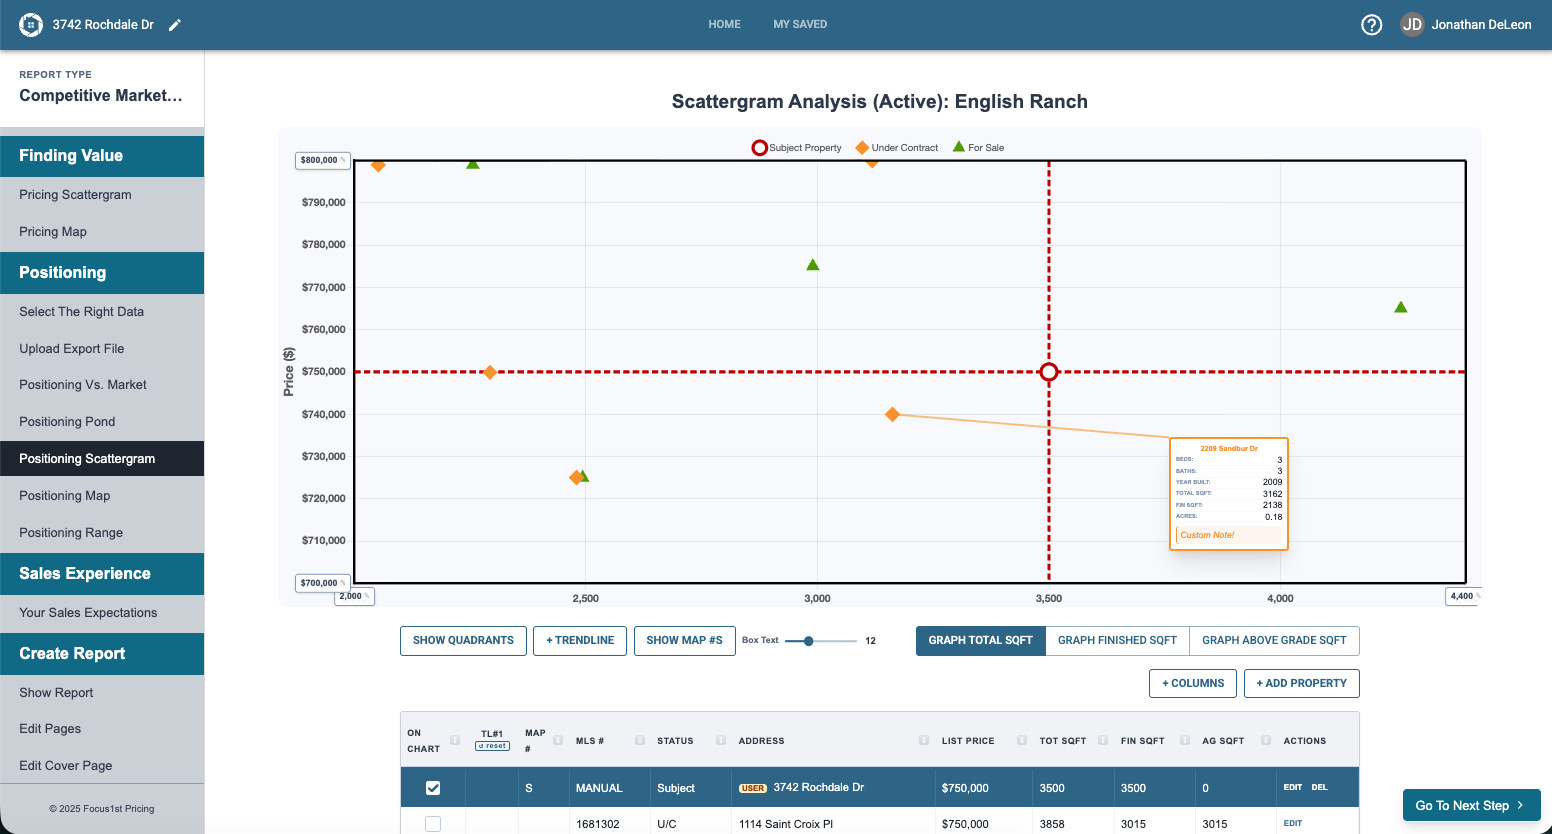
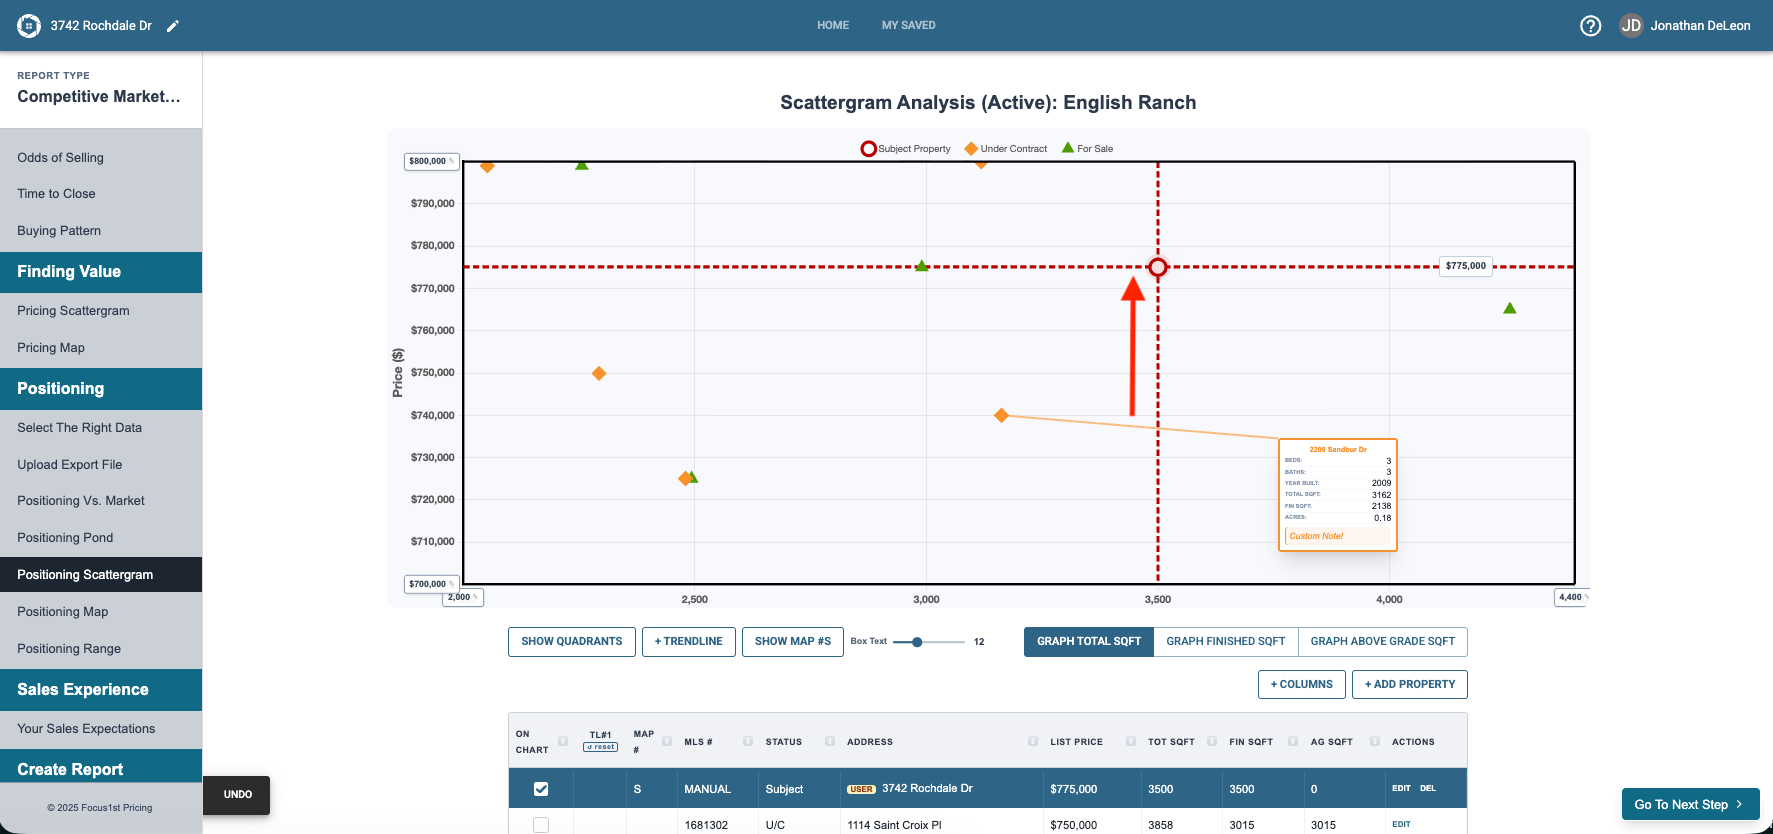
As you use this graph to compare to competing properties and often want to position the house higher or lower and re-evaluate, we make changing the price easy. Simply hold the shift key and click and drag the subject property up or down as you wish. You’ll see a dollar amount text box temporary load to show you what value you’re dragging the line to.
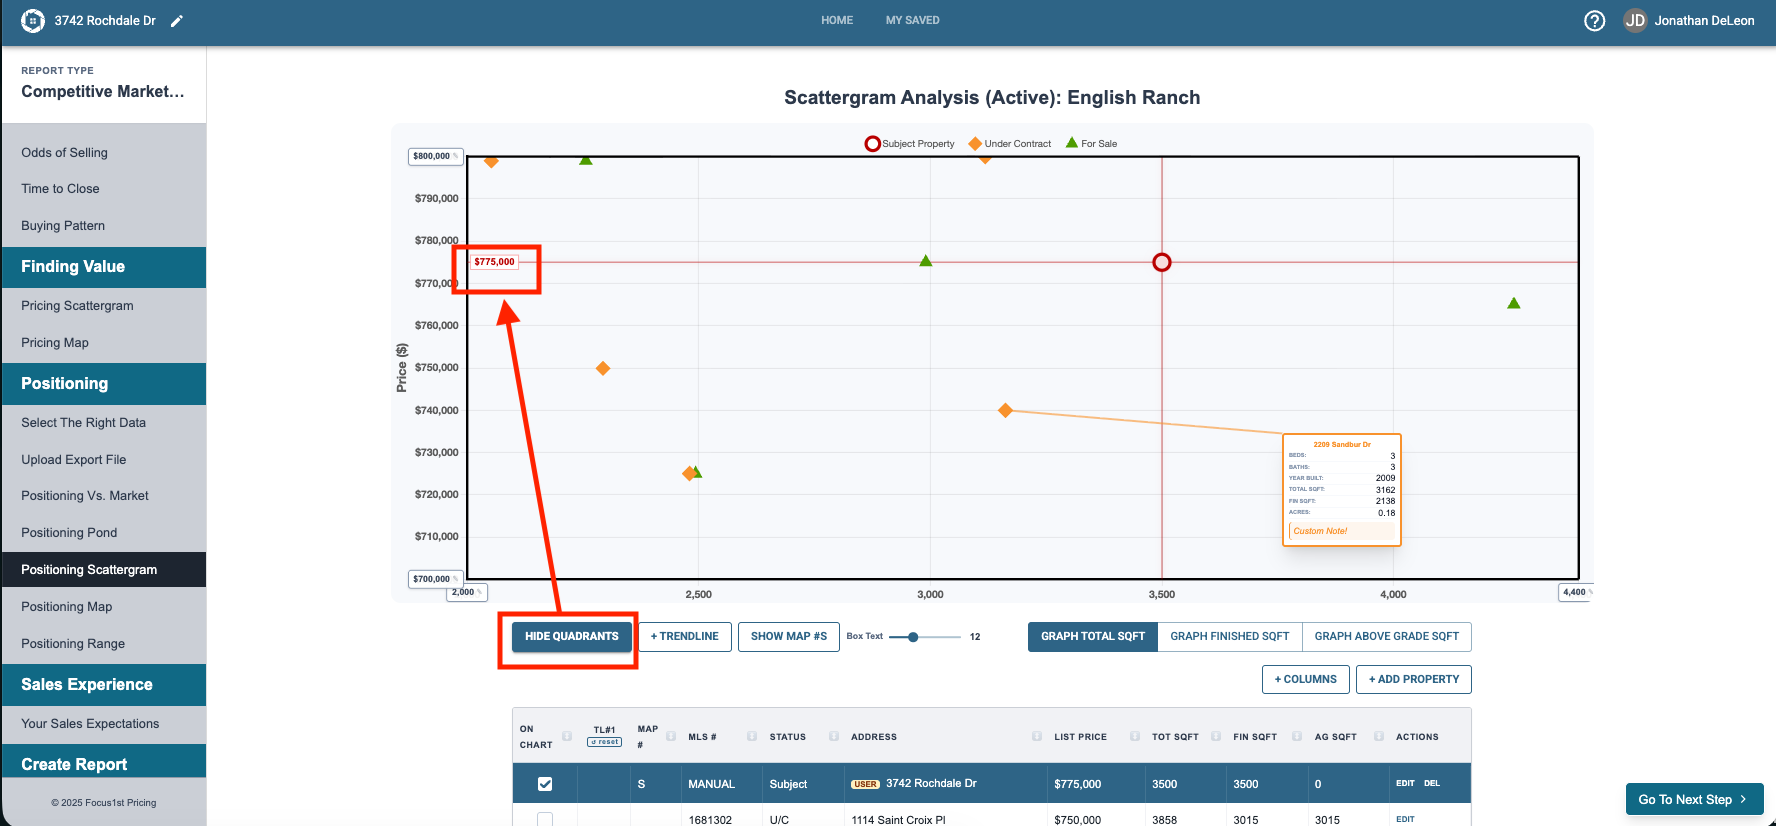
If you want to have that label stay, click the button on the bottom left to turn on quadrants. NOTE: With the quadrants enabled the control will say HIDE as that’s what clicking it again would do, while it says SHOW when the quadrants aren’t showing. This control allows you to turn the intersects on and off easily if you didn’t check the boxes in the add property in particular.
To add a text box to the subject property you will click the property dot as well and use the controls to customize it as you wish.